
- Start >
- Rivers >
- Waterlevel >
- Obere Donau >
- Harburg >
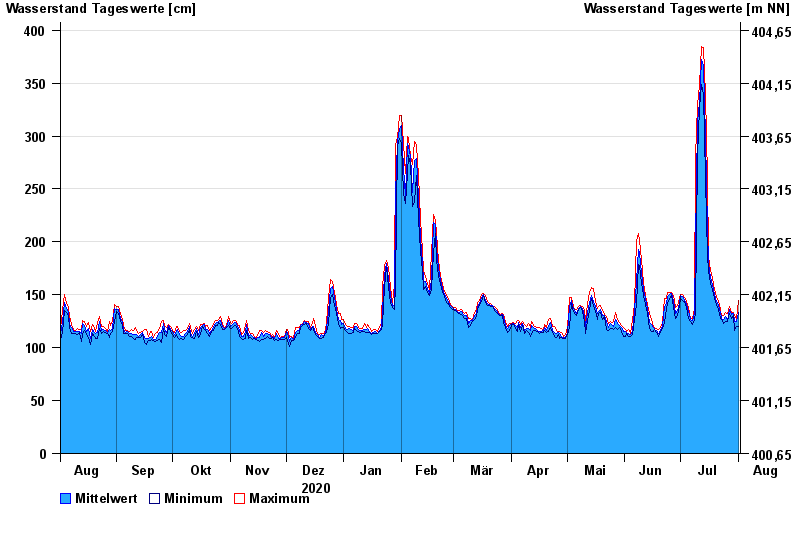
- Chart of year

Chart of year Harburg / Wörnitz
Waterlevel from 02.08.2020 to 01.08.2021
| Date | Mean value [cm] | Maximum [cm] | Minimum [cm] |
|---|---|---|---|
| 01.08.2021 | 133 | 145 | 120 |
| 31.07.2021 | 125 | 128 | 120 |
| 30.07.2021 | 125 | 130 | 116 |
| 29.07.2021 | 132 | 133 | 130 |
| 28.07.2021 | 131 | 133 | 128 |
| 27.07.2021 | 136 | 139 | 132 |
| 26.07.2021 | 126 | 132 | 125 |
© Bayerisches Landesamt für Umwelt 2024