
- Start >
- Rivers >
- Waterlevel >
- Obere Donau >
- Freising >
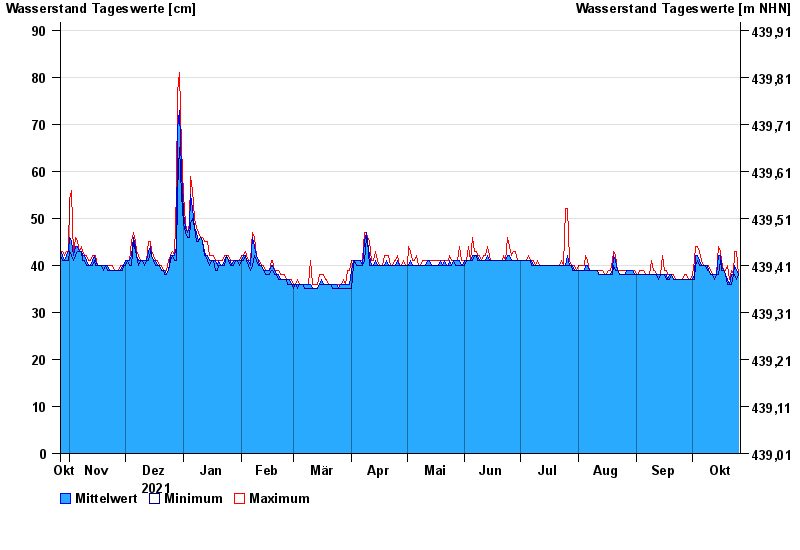
- Chart of year

Chart of year Freising / Schleifermoosach
Waterlevel from 27.10.2021 to 26.10.2022
- 02.06.2013 Wasserstand: 231 cm
- 24.08.2005 Wasserstand: 179 cm
- 23.05.1999 Wasserstand: 160 cm
- 02.06.1995 Wasserstand: 158 cm
- 12.08.2002 Wasserstand: 155 cm
| Date | Mean value [cm] | Maximum [cm] | Minimum [cm] |
|---|---|---|---|
| 26.10.2022 | 38 | 38 | 38 |
| 25.10.2022 | 39 | 43 | 37 |
| 24.10.2022 | 40 | 43 | 38 |
| 23.10.2022 | 38 | 38 | 38 |
| 22.10.2022 | 38 | 39 | 36 |
| 21.10.2022 | 36 | 37 | 36 |
| 20.10.2022 | 37 | 40 | 36 |
© Bayerisches Landesamt für Umwelt 2024