
- Start >
- Rivers >
- Waterlevel >
- Obere Donau >
- Freising >
- Chart of total period

Chart of total period Freising / Isar
Waterlevel from 01.11.1979 to 29.04.2024
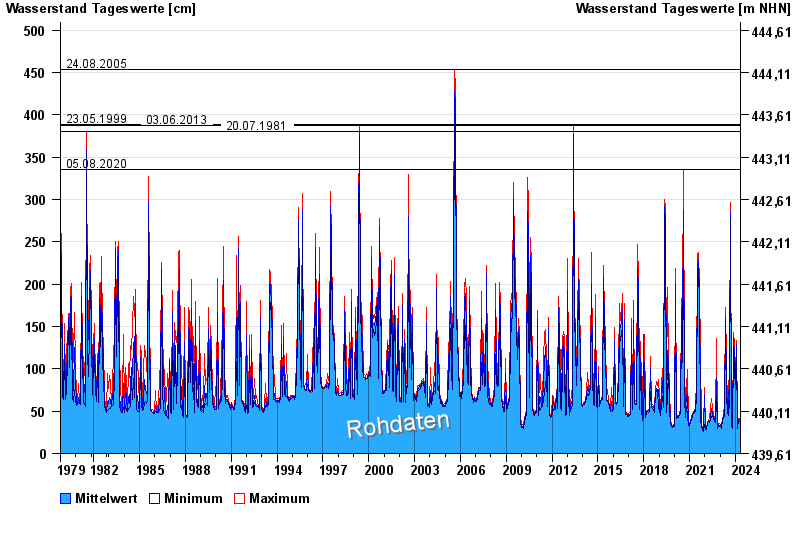
- 24.08.2005 Wasserstand: 453 cm
- 23.05.1999 Wasserstand: 389 cm
- 03.06.2013 Wasserstand: 388 cm
- 20.07.1981 Wasserstand: 380 cm
- 05.08.2020 Wasserstand: 336 cm
| Date | Mean value [cm] | Maximum [cm] | Minimum [cm] |
|---|---|---|---|
| 29.04.2024 | 38 | 40 | 37 |
| 28.04.2024 | 38 | 39 | 37 |
| 27.04.2024 | 38 | 39 | 37 |
| 26.04.2024 | 39 | 40 | 38 |
| 25.04.2024 | 38 | 39 | 36 |
| 24.04.2024 | 38 | 40 | 37 |
| 23.04.2024 | 39 | 40 | 38 |
© Bayerisches Landesamt für Umwelt 2024