
- Start >
- Rivers >
- Waterlevel >
- Obere Donau >
- Fischach >
- Chart of year

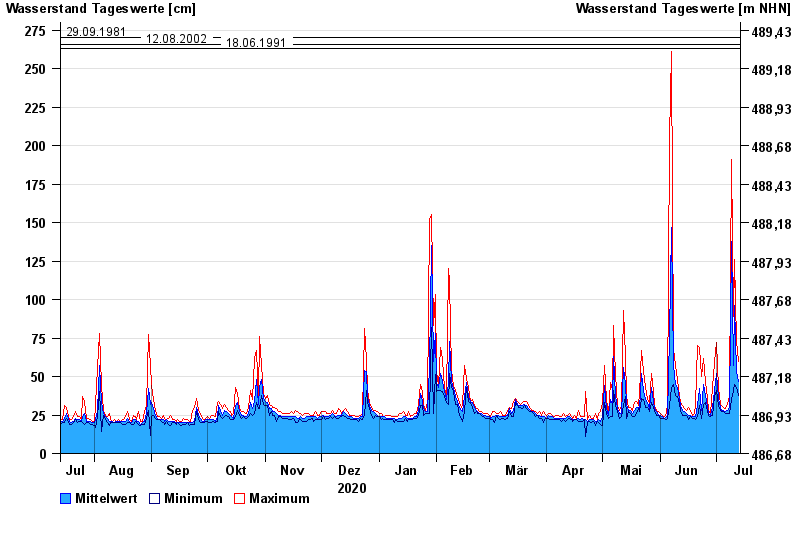
Chart of year Fischach / Schmutter
Waterlevel from 14.07.2020 to 13.07.2021
- 22.08.2005 Wasserstand: 316 cm
- 31.07.1977 Wasserstand: 297 cm
- 29.09.1981 Wasserstand: 270 cm
- 12.08.2002 Wasserstand: 266 cm
- 18.06.1991 Wasserstand: 263 cm
| Date | Mean value [cm] | Maximum [cm] | Minimum [cm] |
|---|---|---|---|
| 13.07.2021 | 47 | 60 | 38 |
| 12.07.2021 | 53 | 73 | 43 |
| 11.07.2021 | 96 | 126 | 45 |
| 10.07.2021 | 57 | 89 | 41 |
| 09.07.2021 | 138 | 191 | 35 |
| 08.07.2021 | 30 | 38 | 26 |
| 07.07.2021 | 28 | 32 | 26 |
© Bayerisches Landesamt für Umwelt 2024