
- Start >
- Rivers >
- Waterlevel >
- Obere Donau >
- Eichstätt >
- Chart of year

Chart of year Eichstätt / Altmühl
Waterlevel from 30.03.2024 to 29.03.2025
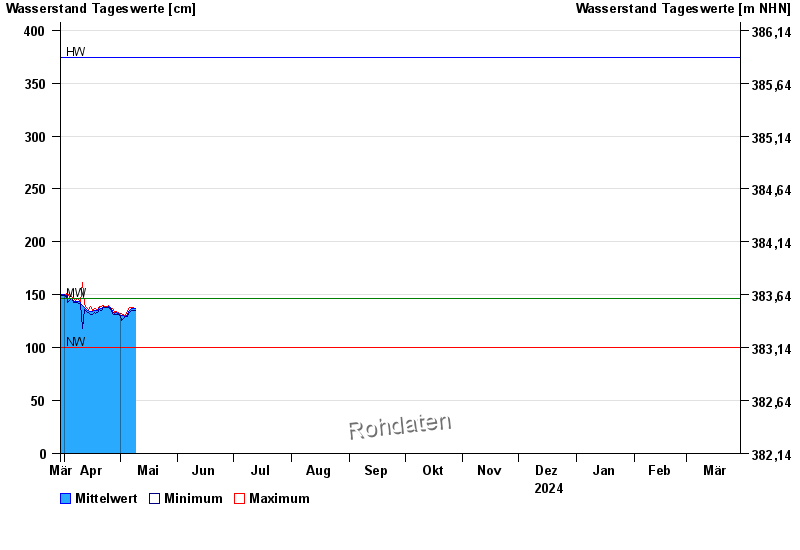
| Date | Mean value [cm] | Maximum [cm] | Minimum [cm] |
|---|---|---|---|
| 09.05.2024 | 137 | 137 | 136 |
| 08.05.2024 | 137 | 138 | 135 |
| 07.05.2024 | 137 | 138 | 135 |
| 06.05.2024 | 135 | 138 | 133 |
| 05.05.2024 | 131 | 135 | 129 |
| 04.05.2024 | 129 | 130 | 129 |
| 03.05.2024 | 130 | 131 | 128 |
© Bayerisches Landesamt für Umwelt 2024