
- Start >
- Rivers >
- Waterlevel >
- Obere Donau >
- Donauwörth >
- Chart of total period

Chart of total period Donauwörth / Donau
Waterlevel from 01.11.1979 to 26.04.2024
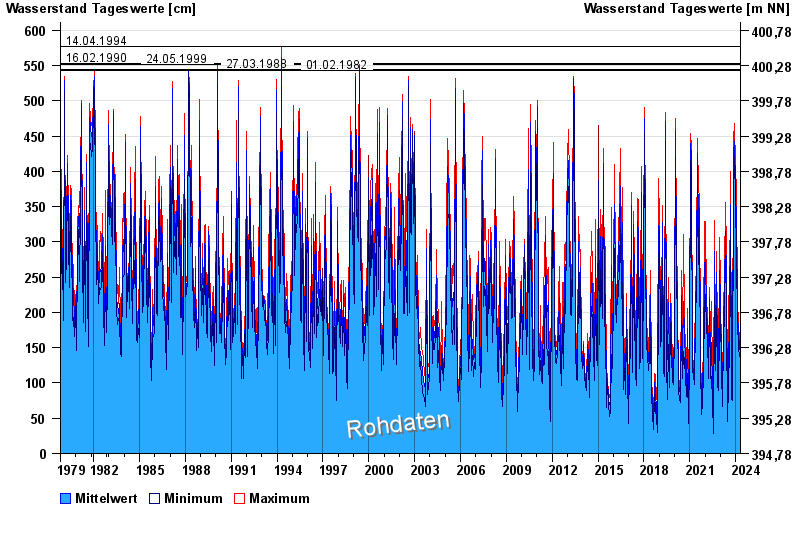
- 14.04.1994 Wasserstand: 577 cm
- 16.02.1990 Wasserstand: 553 cm
- 24.05.1999 Wasserstand: 552 cm
- 27.03.1988 Wasserstand: 544 cm
- 01.02.1982 Wasserstand: 543 cm
| Date | Mean value [cm] | Maximum [cm] | Minimum [cm] |
|---|---|---|---|
| 26.04.2024 | 109 | 115 | 104 |
| 25.04.2024 | 112 | 120 | 107 |
| 24.04.2024 | 117 | 125 | 113 |
| 23.04.2024 | 127 | 136 | 118 |
| 22.04.2024 | 145 | 157 | 131 |
| 21.04.2024 | 147 | 154 | 141 |
| 20.04.2024 | 151 | 164 | 134 |
© Bayerisches Landesamt für Umwelt 2024