
- Start >
- Rivers >
- Waterlevel >
- Obere Donau >
- Deuerling >
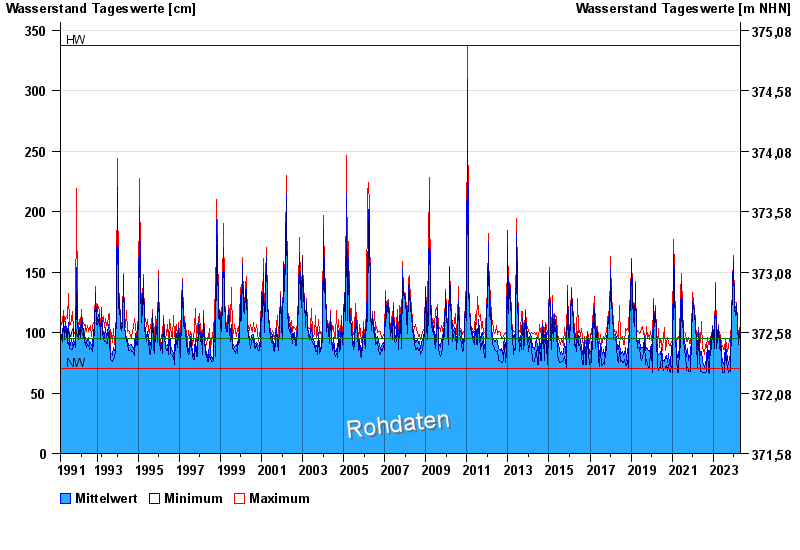
- Chart of total period

Chart of total period Deuerling / Schwarze Laber
Waterlevel from 18.03.1991 to 29.04.2024
| Date | Mean value [cm] | Maximum [cm] | Minimum [cm] |
|---|---|---|---|
| 29.04.2024 | 93 | 93 | 92 |
| 28.04.2024 | 94 | 95 | 92 |
| 27.04.2024 | 95 | 97 | 94 |
| 26.04.2024 | 97 | 99 | 96 |
| 25.04.2024 | 98 | 101 | 97 |
| 24.04.2024 | 100 | 101 | 99 |
| 23.04.2024 | 102 | 103 | 100 |
© Bayerisches Landesamt für Umwelt 2024