
- Start >
- Rivers >
- Waterlevel >
- Obere Donau >
- Dasing >
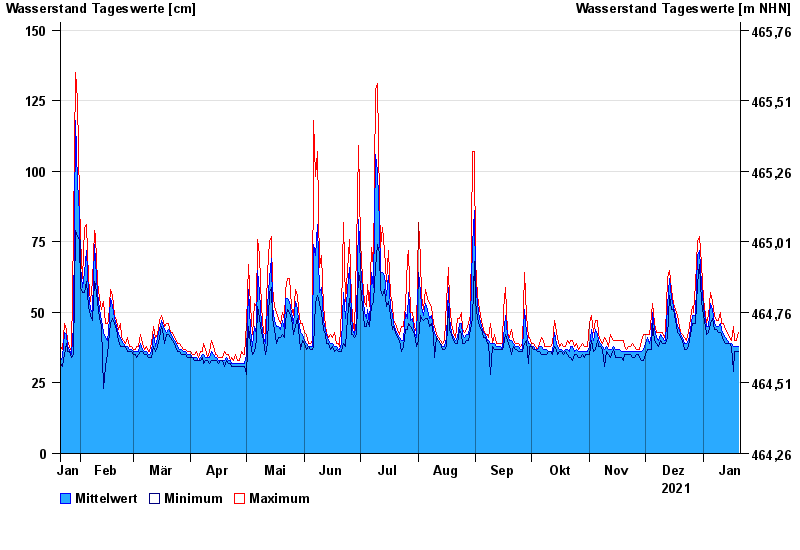
- Chart of year

Chart of year Dasing / Paar
Waterlevel from 21.01.2021 to 20.01.2022
- 04.09.1977 Wasserstand: 345 cm
- 22.05.1999 Wasserstand: 229 cm
- 22.09.2000 Wasserstand: 219 cm
- 09.03.2006 Wasserstand: 218 cm
- 11.08.2002 Wasserstand: 214 cm
| Date | Mean value [cm] | Maximum [cm] | Minimum [cm] |
|---|---|---|---|
| 20.01.2022 | 38 | 43 | 36 |
| 19.01.2022 | 38 | 40 | 36 |
| 18.01.2022 | 38 | 40 | 36 |
| 17.01.2022 | 38 | 45 | 29 |
| 16.01.2022 | 39 | 40 | 38 |
| 15.01.2022 | 39 | 41 | 39 |
| 14.01.2022 | 40 | 43 | 39 |
© Bayerisches Landesamt für Umwelt 2024