
- Start >
- Rivers >
- Waterlevel >
- Obere Donau >
- Binzwangen >
- Chart of month

Chart of month Binzwangen / Altmühl
Waterlevel from 01.11.2020 to 30.11.2020
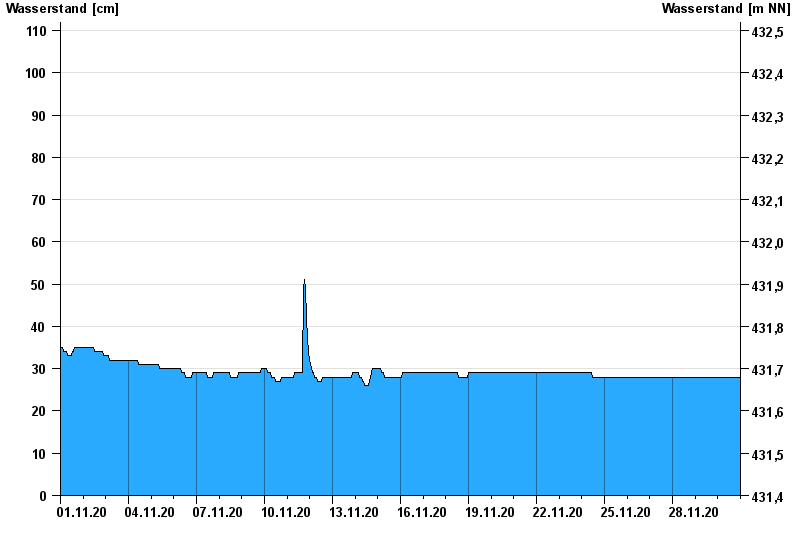
note
Wasserstand und Abfluss wird zeitweise durch Biberdamm beeinflusst.
- 21.12.1993 Wasserstand: 194 cm
- 17.03.2005 Wasserstand: 193 cm
- 09.03.2006 Wasserstand: 189 cm
- 29.10.1998 Wasserstand: 186 cm
- 21.05.1999 Wasserstand: 185 cm
| Date | Waterlevel [cm] |
|---|---|
| 30.11.2020 23:45 | 28 |
| 30.11.2020 23:30 | 28 |
| 30.11.2020 23:15 | 28 |
| 30.11.2020 23:00 | 28 |
| 30.11.2020 22:45 | 28 |
| 30.11.2020 22:30 | 28 |
| 30.11.2020 22:15 | 28 |
© Bayerisches Landesamt für Umwelt 2024