
- Start >
- Rivers >
- Waterlevel >
- Obere Donau >
- Beilngries oberh. der Sulz >
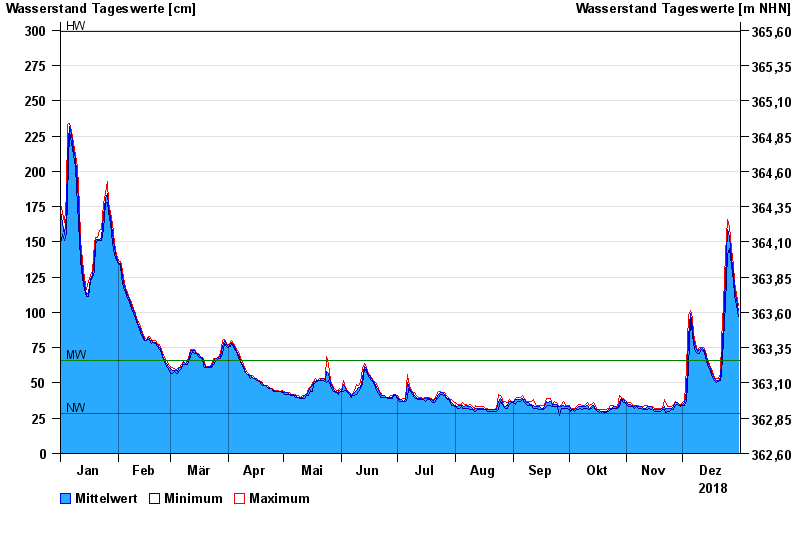
- Chart of year

Chart of year Beilngries oberh. der Sulz / Altmühl
Waterlevel from 01.01.2018 to 31.12.2018
| Date | Mean value [cm] | Maximum [cm] | Minimum [cm] |
|---|---|---|---|
| 31.12.2018 | 101 | 105 | 97 |
| 30.12.2018 | 109 | 113 | 105 |
| 29.12.2018 | 117 | 122 | 112 |
| 28.12.2018 | 128 | 133 | 122 |
| 27.12.2018 | 138 | 145 | 133 |
| 26.12.2018 | 154 | 161 | 145 |
| 25.12.2018 | 159 | 166 | 141 |
© Bayerisches Landesamt für Umwelt 2024