
- Start >
- Rivers >
- Waterlevel >
- Obere Donau >
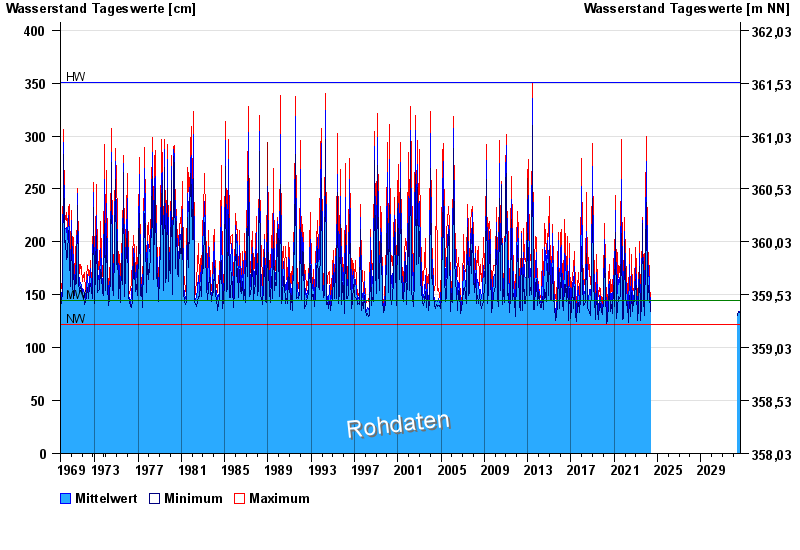
- Aunkofen >
- Chart of total period

Chart of total period Aunkofen / Abens
Waterlevel from 01.11.1969 to 02.09.2032
| Date | Mean value [cm] | Maximum [cm] | Minimum [cm] |
|---|---|---|---|
| 02.09.2032 | 131 | 131 | 131 |
| 01.09.2032 | 133 | 135 | 129 |
| 31.08.2032 | -- | -- | -- |
| 30.08.2032 | -- | -- | -- |
| 29.08.2032 | -- | -- | -- |
| 28.08.2032 | -- | -- | -- |
| 27.08.2032 | -- | -- | -- |
© Bayerisches Landesamt für Umwelt 2024