
- Start >
- Rivers >
- Waterlevel >
- Obere Donau >
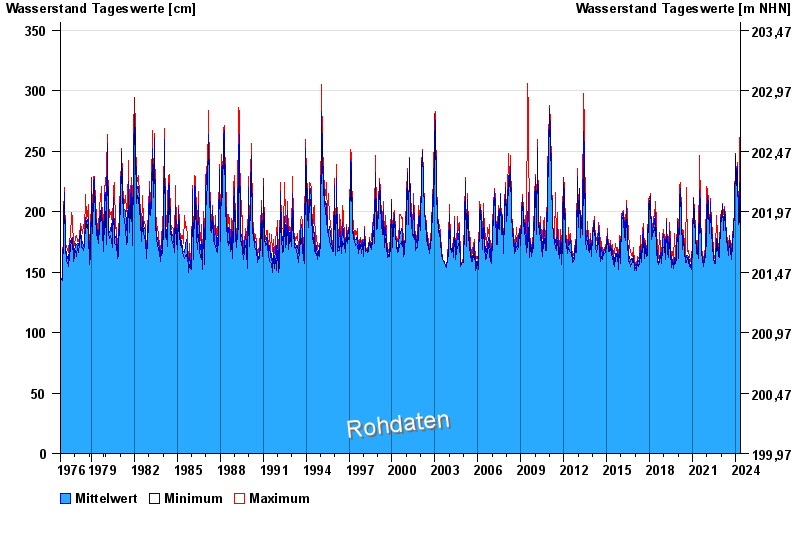
- Arnstein >
- Chart of total period

Chart of total period Arnstein / Wern
Waterlevel from 01.11.1976 to 08.05.2024
| Date | Mean value [cm] | Maximum [cm] | Minimum [cm] |
|---|---|---|---|
| 08.05.2024 | 188 | 190 | 187 |
| 07.05.2024 | 193 | 194 | 190 |
| 06.05.2024 | 193 | 195 | 192 |
| 05.05.2024 | 195 | 197 | 193 |
| 04.05.2024 | 207 | 218 | 198 |
| 03.05.2024 | 253 | 308 | 218 |
| 02.05.2024 | 193 | 323 | 178 |
© Bayerisches Landesamt für Umwelt 2024