
- Start >
- Rivers >
- Waterlevel >
- Obere Donau >
- Ansbach >
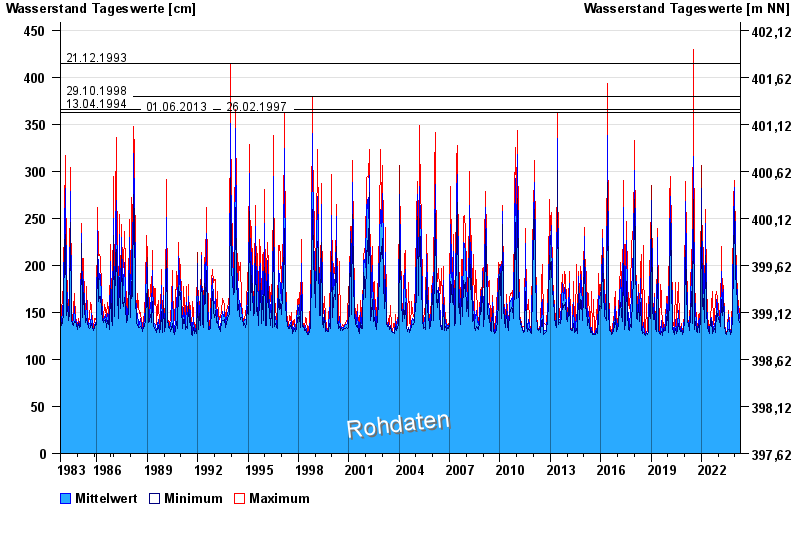
- Chart of total period

Chart of total period Ansbach / Fränkische Rezat
Waterlevel from 01.11.1983 to 29.04.2024
note
Wasserstand und Abfluss wird zeitweise durch Biberdamm beeinflusst.
- 21.12.1993 Wasserstand: 415 cm
- 29.10.1998 Wasserstand: 380 cm
- 13.04.1994 Wasserstand: 366 cm
- 01.06.2013 Wasserstand: 362 cm
- 26.02.1997 Wasserstand: 362 cm
| Date | Mean value [cm] | Maximum [cm] | Minimum [cm] |
|---|---|---|---|
| 29.04.2024 | 131 | 131 | 131 |
| 28.04.2024 | 131 | 132 | 131 |
| 27.04.2024 | 132 | 132 | 132 |
| 26.04.2024 | 133 | 133 | 132 |
| 25.04.2024 | 133 | 133 | 133 |
| 24.04.2024 | 133 | 134 | 133 |
| 23.04.2024 | 135 | 136 | 134 |
© Bayerisches Landesamt für Umwelt 2024