
- Start >
- Rivers >
- Waterlevel >
- Obere Donau >
- Altendorf >
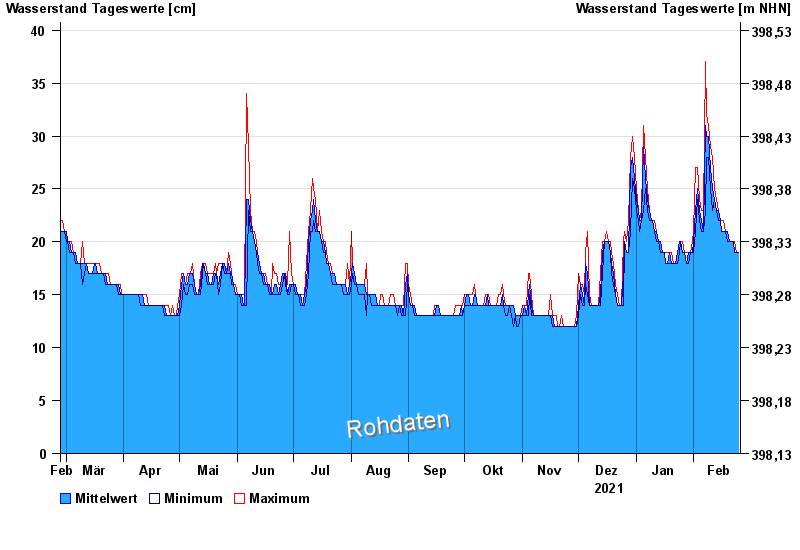
- Chart of year

Chart of year Altendorf / Gailach
Waterlevel from 26.02.2021 to 25.02.2022
- 13.01.2011 Wasserstand: 165 cm
- 05.01.2018 Wasserstand: 138 cm
- 10.06.2013 Wasserstand: 94 cm
- 05.02.2013 Wasserstand: 86 cm
- 25.01.2012 Wasserstand: 82 cm
| Date | Mean value [cm] | Maximum [cm] | Minimum [cm] |
|---|---|---|---|
| 25.02.2022 | 19 | 19 | 19 |
| 24.02.2022 | 19 | 19 | 19 |
| 23.02.2022 | 19 | 20 | 19 |
| 22.02.2022 | 20 | 20 | 20 |
| 21.02.2022 | 20 | 20 | 20 |
| 20.02.2022 | 20 | 20 | 20 |
| 19.02.2022 | 21 | 21 | 20 |
© Bayerisches Landesamt für Umwelt 2024