
- Start >
- Rivers >
- Waterlevel >
- Obere Donau >
- Aha >
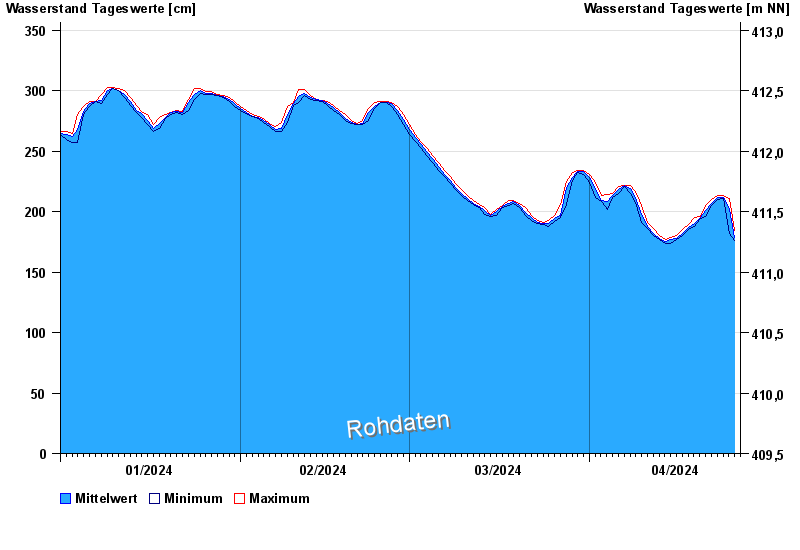
- Chart of year

Chart of year Aha / Altmühl
Waterlevel from 01.01.2024 to 26.04.2024
| Date | Mean value [cm] | Maximum [cm] | Minimum [cm] |
|---|---|---|---|
| 26.04.2024 | 179 | 182 | 178 |
| 25.04.2024 | 203 | 211 | 182 |
| 24.04.2024 | 212 | 213 | 211 |
| 23.04.2024 | 212 | 213 | 210 |
| 22.04.2024 | 207 | 210 | 205 |
| 21.04.2024 | 201 | 205 | 196 |
| 20.04.2024 | 195 | 196 | 194 |
© Bayerisches Landesamt für Umwelt 2024