
- Start >
- Rivers >
- Waterlevel >
- Isar >
- Vohburg >
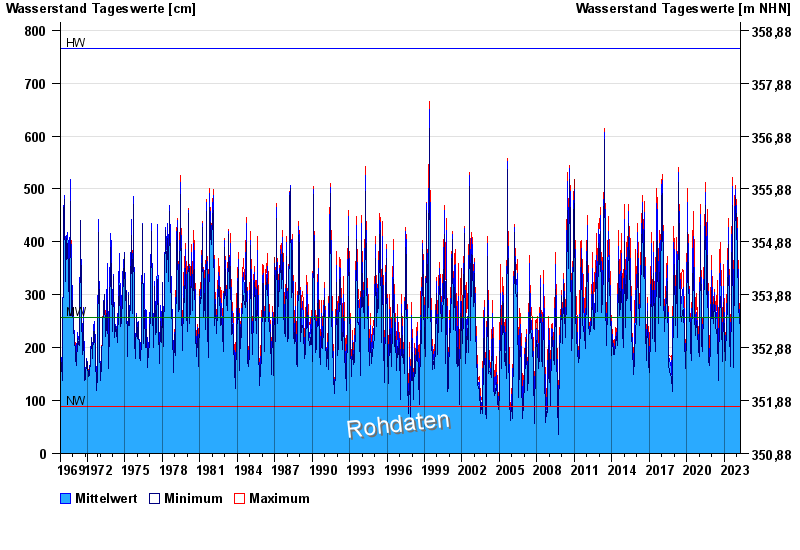
- Chart of total period

Chart of total period Vohburg / Donau
Waterlevel from 01.11.1969 to 26.04.2024
| Date | Mean value [cm] | Maximum [cm] | Minimum [cm] |
|---|---|---|---|
| 26.04.2024 | 204 | 210 | 194 |
| 25.04.2024 | 204 | 210 | 194 |
| 24.04.2024 | 206 | 214 | 200 |
| 23.04.2024 | 221 | 235 | 212 |
| 22.04.2024 | 236 | 237 | 233 |
| 21.04.2024 | 240 | 253 | 230 |
| 20.04.2024 | 244 | 253 | 235 |
© Bayerisches Landesamt für Umwelt 2024