
- Start >
- Rivers >
- Waterlevel >
- Isar >
- Valley >
- Chart of year

Chart of year Valley / Mangfall
Waterlevel from 20.04.2024 to 19.04.2025
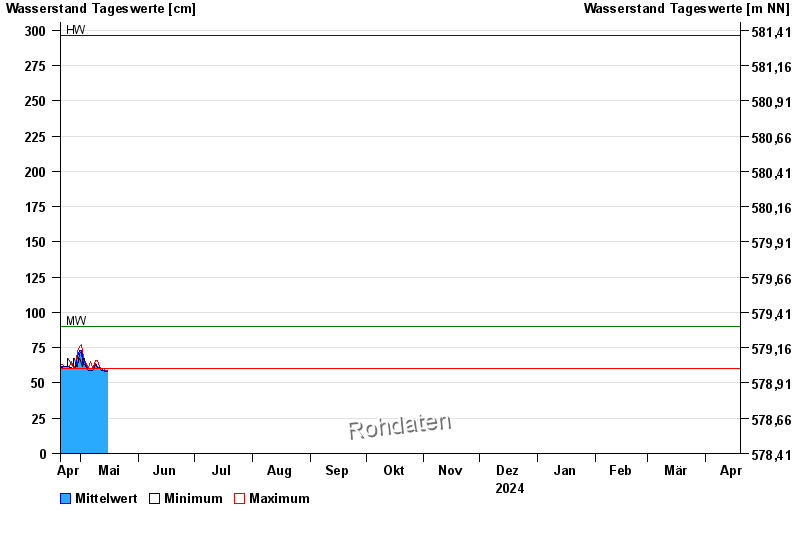
| Date | Mean value [cm] | Maximum [cm] | Minimum [cm] |
|---|---|---|---|
| 17.05.2024 | 59 | 60 | 58 |
| 16.05.2024 | 58 | 58 | 57 |
| 15.05.2024 | 58 | 59 | 58 |
| 14.05.2024 | 59 | 59 | 58 |
| 13.05.2024 | 59 | 60 | 59 |
| 12.05.2024 | 60 | 60 | 59 |
| 11.05.2024 | 61 | 62 | 60 |
© Bayerisches Landesamt für Umwelt 2024