
- Start >
- Rivers >
- Waterlevel >
- Isar >
- Valley >
- Chart of year

Chart of year Valley / Mangfall
Waterlevel from 20.04.2024 to 19.04.2025
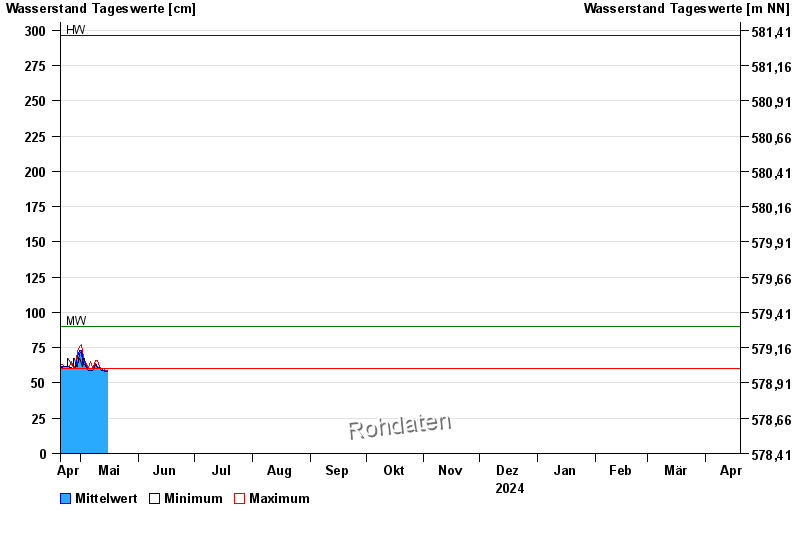
| Date | Mean value [cm] | Maximum [cm] | Minimum [cm] |
|---|---|---|---|
| 06.06.2024 | 138 | 144 | 132 |
| 05.06.2024 | 157 | 170 | 144 |
| 04.06.2024 | 186 | 211 | 170 |
| 03.06.2024 | 177 | 263 | 117 |
| 02.06.2024 | 124 | 131 | 118 |
| 01.06.2024 | 124 | 140 | 81 |
| 31.05.2024 | 75 | 85 | 66 |
© Bayerisches Landesamt für Umwelt 2024