
- Start >
- Rivers >
- Waterlevel >
- Isar >
- Unverzug >
- Chart of total period

Chart of total period Unverzug / Götzinger Achen
Waterlevel from 01.11.1969 to 29.04.2024
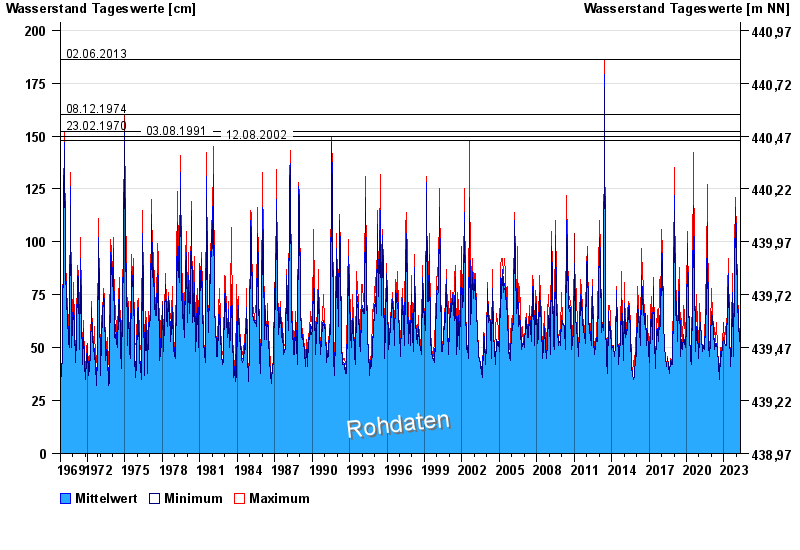
- 02.06.2013 Wasserstand: 186 cm
- 08.12.1974 Wasserstand: 160 cm
- 23.02.1970 Wasserstand: 152 cm
- 03.08.1991 Wasserstand: 150 cm
- 12.08.2002 Wasserstand: 148 cm
| Date | Mean value [cm] | Maximum [cm] | Minimum [cm] |
|---|---|---|---|
| 29.04.2024 | 52 | 52 | 51 |
| 28.04.2024 | 51 | 52 | 51 |
| 27.04.2024 | 51 | 53 | 45 |
| 26.04.2024 | 52 | 52 | 51 |
| 25.04.2024 | 52 | 52 | 52 |
| 24.04.2024 | 52 | 52 | 51 |
| 23.04.2024 | 51 | 52 | 51 |
© Bayerisches Landesamt für Umwelt 2024