
- Start >
- Rivers >
- Waterlevel >
- Isar >
- Unterbergen >
- Chart of year

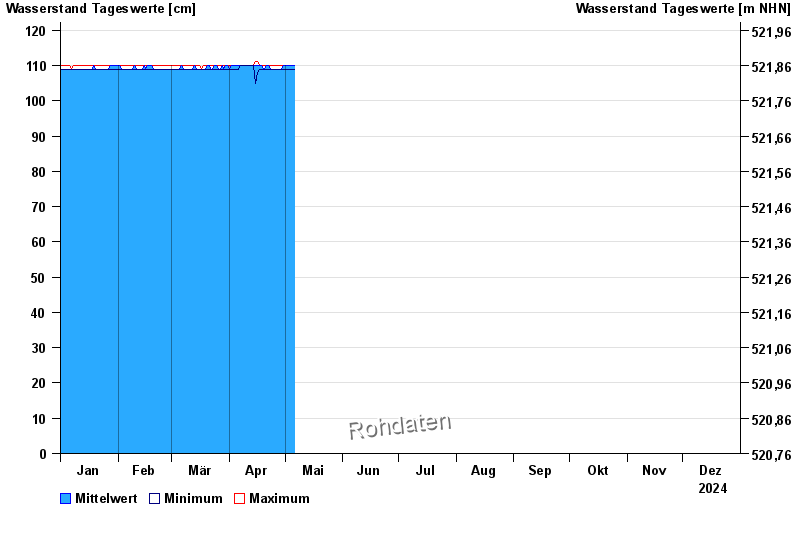
Chart of year Unterbergen / Lochbach
Waterlevel from 01.01.2024 to 31.12.2024
- Wasserstand: cm
- Wasserstand: cm
- Wasserstand: cm
- Wasserstand: cm
- Wasserstand: cm
| Date | Mean value [cm] | Maximum [cm] | Minimum [cm] |
|---|---|---|---|
| 24.05.2024 | 110 | 110 | 110 |
| 23.05.2024 | 109 | 110 | 109 |
| 22.05.2024 | 110 | 110 | 109 |
| 21.05.2024 | 110 | 110 | 109 |
| 20.05.2024 | 109 | 110 | 109 |
| 19.05.2024 | 110 | 110 | 109 |
| 18.05.2024 | 110 | 110 | 110 |
© Bayerisches Landesamt für Umwelt 2024