
- Start >
- Rivers >
- Waterlevel >
- Isar >
- Teisendorf >
- Chart of year

Chart of year Teisendorf / Sur
Waterlevel from 30.03.2024 to 29.03.2025
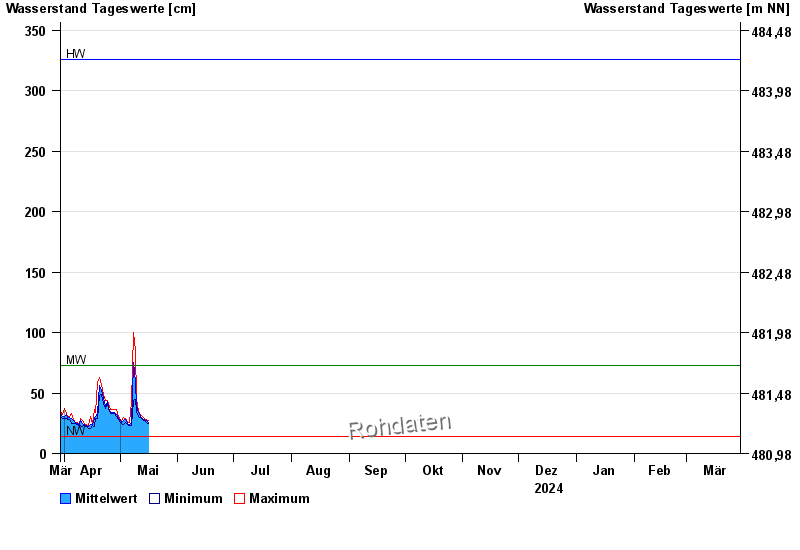
| Date | Mean value [cm] | Maximum [cm] | Minimum [cm] |
|---|---|---|---|
| 05.06.2024 | 58 | 61 | 56 |
| 04.06.2024 | 90 | 179 | 61 |
| 03.06.2024 | 105 | 206 | 49 |
| 02.06.2024 | 64 | 78 | 50 |
| 01.06.2024 | 82 | 122 | 48 |
| 31.05.2024 | 56 | 74 | 40 |
| 30.05.2024 | 34 | 61 | 27 |
© Bayerisches Landesamt für Umwelt 2024