
- Start >
- Rivers >
- Waterlevel >
- Isar >
- Seebruck >
- Chart of year

Chart of year Seebruck / Alz
Waterlevel from 15.08.2019 to 14.08.2020
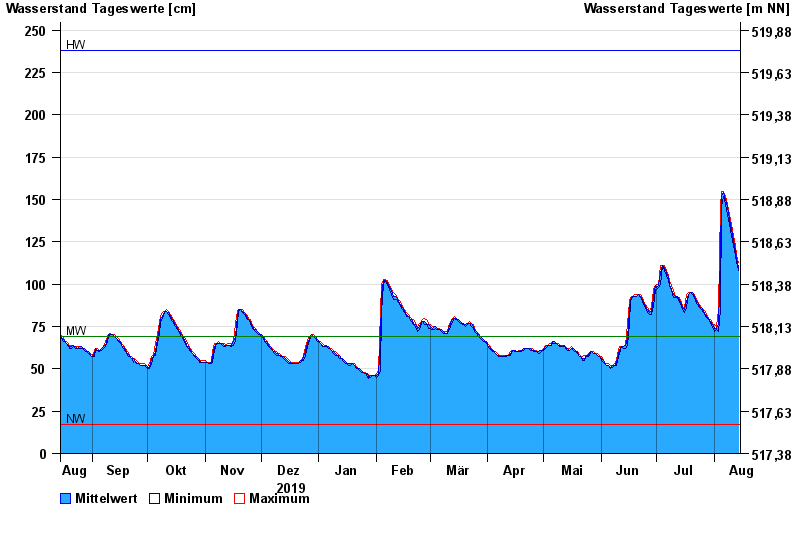
| Date | Mean value [cm] | Maximum [cm] | Minimum [cm] |
|---|---|---|---|
| 14.08.2020 | 110 | 113 | 108 |
| 13.08.2020 | 115 | 117 | 113 |
| 12.08.2020 | 120 | 123 | 117 |
| 11.08.2020 | 126 | 129 | 123 |
| 10.08.2020 | 132 | 135 | 129 |
| 09.08.2020 | 138 | 141 | 135 |
| 08.08.2020 | 145 | 147 | 141 |
© Bayerisches Landesamt für Umwelt 2024