
- Start >
- Rivers >
- Waterlevel >
- Isar >
- Seebruck >
- Chart of year

Chart of year Seebruck / Alz
Waterlevel from 15.08.2020 to 14.08.2021
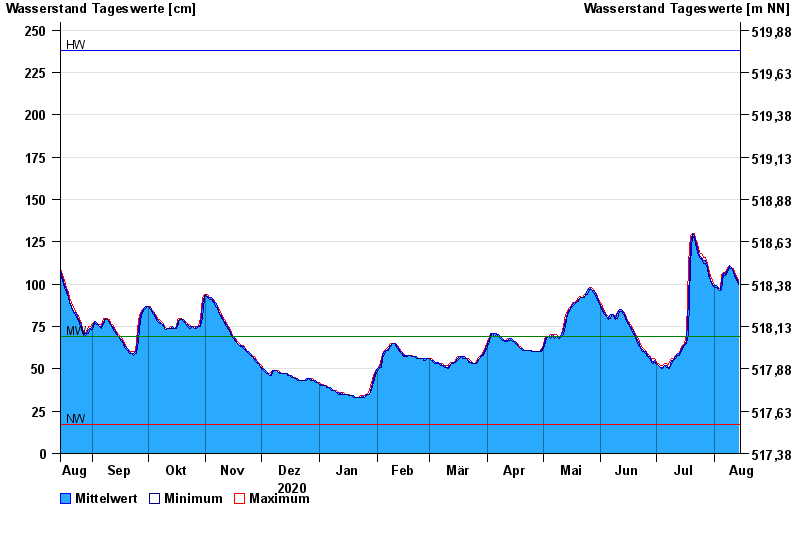
| Date | Mean value [cm] | Maximum [cm] | Minimum [cm] |
|---|---|---|---|
| 14.08.2021 | 101 | 102 | 100 |
| 13.08.2021 | 104 | 105 | 102 |
| 12.08.2021 | 106 | 107 | 105 |
| 11.08.2021 | 108 | 109 | 107 |
| 10.08.2021 | 110 | 110 | 109 |
| 09.08.2021 | 111 | 111 | 110 |
| 08.08.2021 | 108 | 110 | 107 |
© Bayerisches Landesamt für Umwelt 2024