
- Start >
- Rivers >
- Waterlevel >
- Isar >
- Rosenheim u.d. Mangfallmündung >
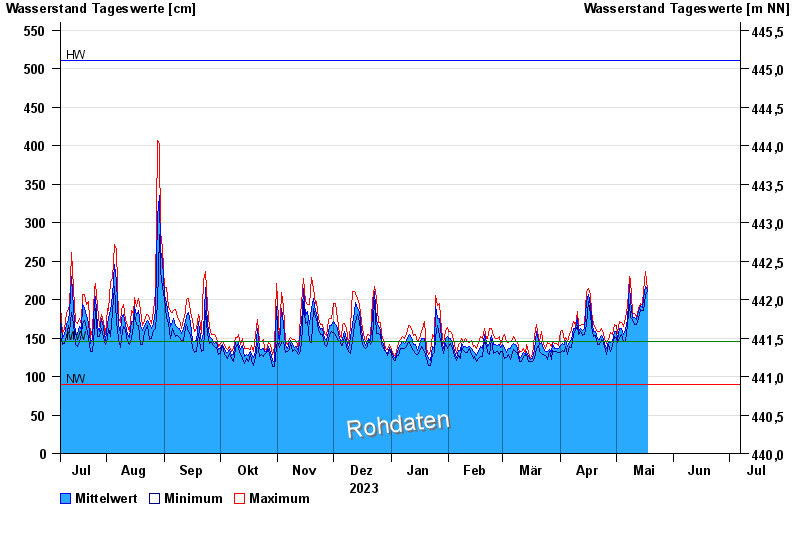
- Chart of year

Chart of year Rosenheim u.d. Mangfallmündung / Inn
Waterlevel from 07.07.2023 to 06.07.2024
| Date | Mean value [cm] | Maximum [cm] | Minimum [cm] |
|---|---|---|---|
| 01.06.2024 | 281 | 299 | 262 |
| 31.05.2024 | 272 | 286 | 241 |
| 30.05.2024 | 225 | 241 | 198 |
| 29.05.2024 | 204 | 222 | 191 |
| 28.05.2024 | 219 | 236 | 195 |
| 27.05.2024 | 184 | 195 | 168 |
| 26.05.2024 | 183 | 196 | 166 |
© Bayerisches Landesamt für Umwelt 2024