
- Start >
- Rivers >
- Waterlevel >
- Isar >
- Raisting >
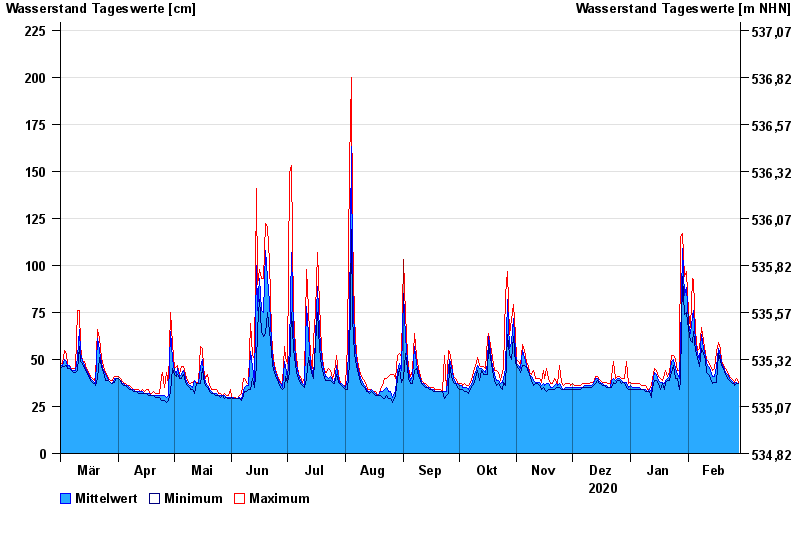
- Chart of year

Chart of year Raisting / Rott
Waterlevel from 01.03.2020 to 28.02.2021
| Date | Mean value [cm] | Maximum [cm] | Minimum [cm] |
|---|---|---|---|
| 28.02.2021 | 37 | 38 | 37 |
| 27.02.2021 | 38 | 40 | 37 |
| 26.02.2021 | 37 | 38 | 36 |
| 25.02.2021 | 38 | 39 | 37 |
| 24.02.2021 | 39 | 40 | 38 |
| 23.02.2021 | 40 | 41 | 39 |
| 22.02.2021 | 42 | 43 | 40 |
© Bayerisches Landesamt für Umwelt 2024