
- Start >
- Rivers >
- Waterlevel >
- Isar >
- Puppling >
- Chart of year

Chart of year Puppling / Isar
Waterlevel from 30.03.2024 to 29.03.2025
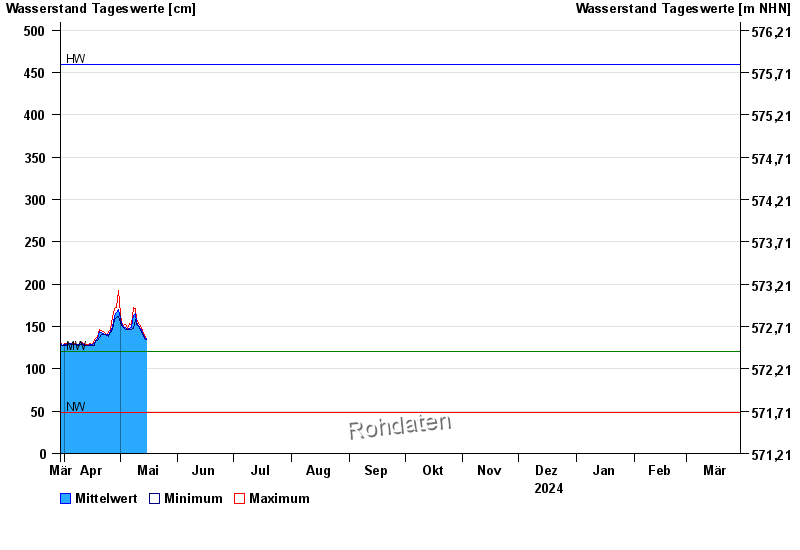
| Date | Mean value [cm] | Maximum [cm] | Minimum [cm] |
|---|---|---|---|
| 29.05.2024 | 195 | 196 | 194 |
| 28.05.2024 | 178 | 204 | 135 |
| 27.05.2024 | 133 | 135 | 132 |
| 26.05.2024 | 136 | 139 | 134 |
| 25.05.2024 | 138 | 142 | 136 |
| 24.05.2024 | 142 | 151 | 137 |
| 23.05.2024 | 135 | 157 | 130 |
© Bayerisches Landesamt für Umwelt 2024