
- Start >
- Rivers >
- Waterlevel >
- Isar >
- Prien >
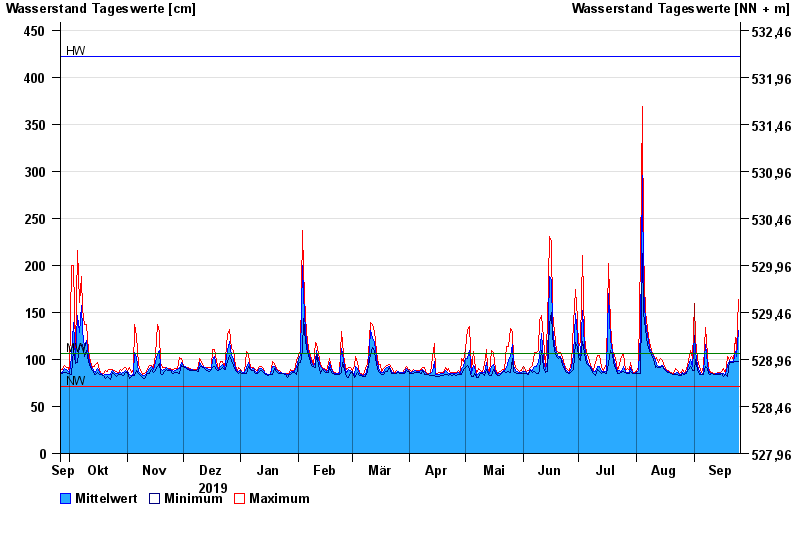
- Chart of year

Chart of year Prien / Prien
Waterlevel from 26.09.2019 to 25.09.2020
| Date | Mean value [cm] | Maximum [cm] | Minimum [cm] |
|---|---|---|---|
| 25.09.2020 | 131 | 164 | 98 |
| 24.09.2020 | 103 | 109 | 98 |
| 23.09.2020 | 108 | 123 | 98 |
| 22.09.2020 | 98 | 99 | 97 |
| 21.09.2020 | 98 | 103 | 97 |
| 20.09.2020 | 99 | 99 | 98 |
| 19.09.2020 | 94 | 103 | 82 |
© Bayerisches Landesamt für Umwelt 2024