
- Start >
- Rivers >
- Waterlevel >
- Isar >
- Peißenberg >
- Chart of year

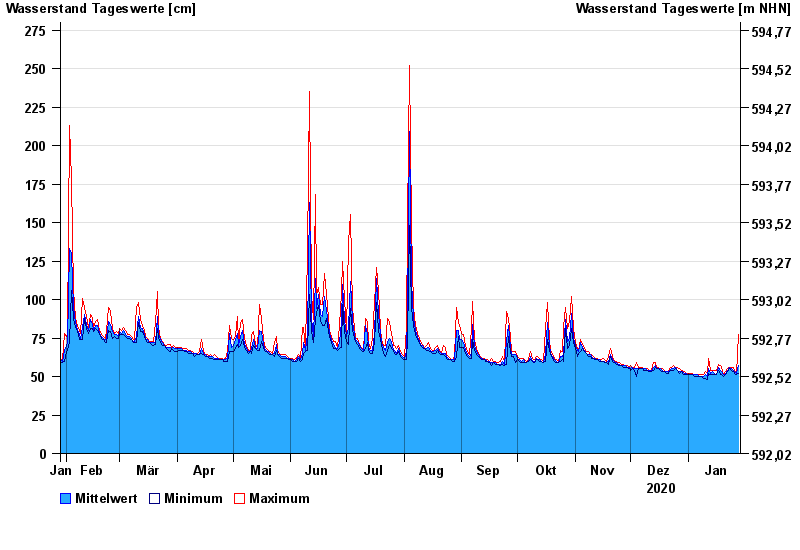
Chart of year Peißenberg / Ammer
Waterlevel from 29.01.2020 to 28.01.2021
- 22.05.1999 Wasserstand: 412 cm
- 23.08.2005 Wasserstand: 366 cm
- 10.08.1970 Wasserstand: 330 cm
- 17.07.1993 Wasserstand: 291 cm
- 23.07.1966 Wasserstand: 287 cm
| Date | Mean value [cm] | Maximum [cm] | Minimum [cm] |
|---|---|---|---|
| 28.01.2021 | 57 | 77 | 52 |
| 27.01.2021 | 52 | 52 | 51 |
| 26.01.2021 | 53 | 54 | 52 |
| 25.01.2021 | 54 | 56 | 53 |
| 24.01.2021 | 55 | 56 | 54 |
| 23.01.2021 | 56 | 56 | 55 |
| 22.01.2021 | 54 | 55 | 53 |
© Bayerisches Landesamt für Umwelt 2024