
- Start >
- Rivers >
- Waterlevel >
- Isar >
- Obermenzing >
- Chart of total period

Chart of total period Obermenzing / Würm
Waterlevel from 01.11.1983 to 10.05.2024
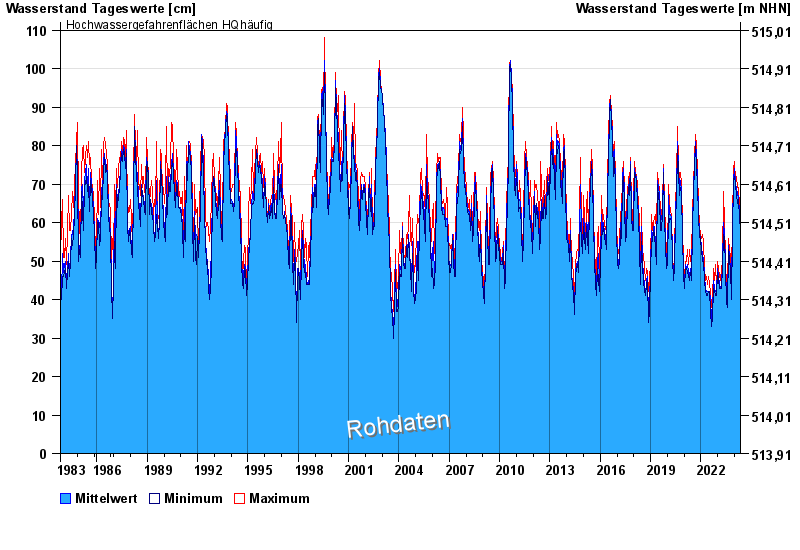
- Hochwassergefahrenfläche HQ100 130 cm
- Hochwassergefahrenfläche HQhäufig 110 cm
| Date | Mean value [cm] | Maximum [cm] | Minimum [cm] |
|---|---|---|---|
| 10.05.2024 | 56 | 56 | 55 |
| 09.05.2024 | 56 | 58 | 52 |
| 08.05.2024 | 57 | 58 | 56 |
| 07.05.2024 | 61 | 63 | 58 |
| 06.05.2024 | 55 | 62 | 53 |
| 05.05.2024 | 54 | 55 | 53 |
| 04.05.2024 | 54 | 56 | 52 |
© Bayerisches Landesamt für Umwelt 2024