
- Start >
- Rivers >
- Waterlevel >
- Isar >
- Oberammergau >
- Chart of total period

Chart of total period Oberammergau / Ammer
Waterlevel from 01.11.1976 to 26.04.2024
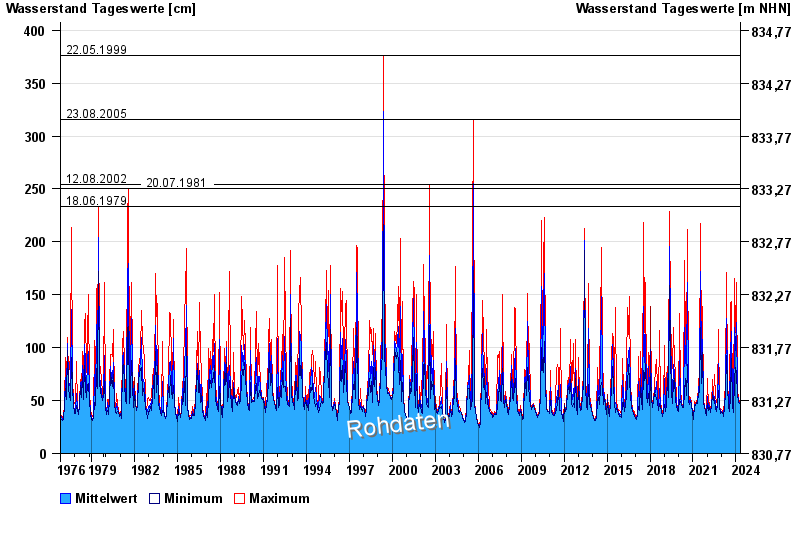
- 22.05.1999 Wasserstand: 376 cm
- 23.08.2005 Wasserstand: 316 cm
- 12.08.2002 Wasserstand: 254 cm
- 20.07.1981 Wasserstand: 250 cm
- 18.06.1979 Wasserstand: 233 cm
| Date | Mean value [cm] | Maximum [cm] | Minimum [cm] |
|---|---|---|---|
| 26.04.2024 | 48 | 48 | 47 |
| 25.04.2024 | 48 | 49 | 47 |
| 24.04.2024 | 47 | 48 | 47 |
| 23.04.2024 | 47 | 48 | 47 |
| 22.04.2024 | 48 | 48 | 47 |
| 21.04.2024 | 48 | 49 | 47 |
| 20.04.2024 | 48 | 49 | 47 |
© Bayerisches Landesamt für Umwelt 2024