
- Start >
- Rivers >
- Waterlevel >
- Isar >
- München >
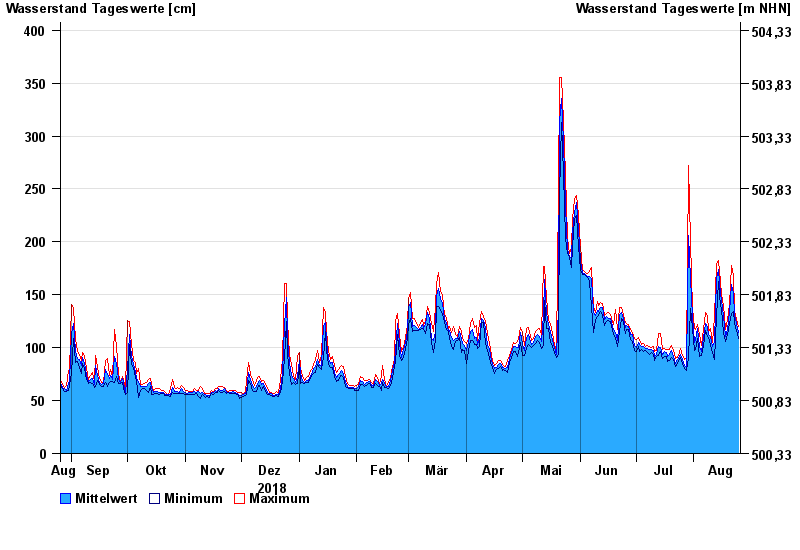
- Chart of year

Chart of year München / Isar
Waterlevel from 26.08.2018 to 25.08.2019
| Date | Mean value [cm] | Maximum [cm] | Minimum [cm] |
|---|---|---|---|
| 25.08.2019 | 114 | 120 | 109 |
| 24.08.2019 | 123 | 127 | 116 |
| 23.08.2019 | 130 | 134 | 123 |
| 22.08.2019 | 151 | 168 | 134 |
| 21.08.2019 | 160 | 178 | 132 |
| 20.08.2019 | 134 | 141 | 123 |
| 19.08.2019 | 117 | 127 | 112 |
© Bayerisches Landesamt für Umwelt 2024