
- Start >
- Rivers >
- Waterlevel >
- Isar >
- München >
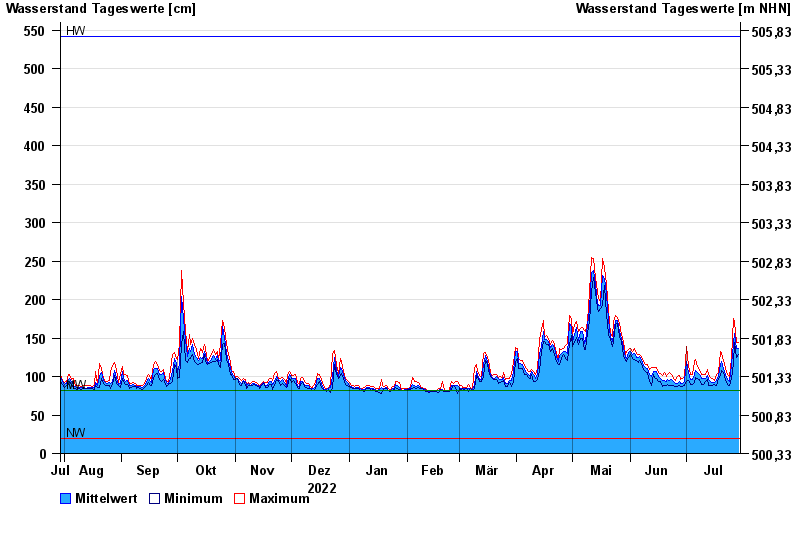
- Chart of year

Chart of year München / Isar
Waterlevel from 30.07.2022 to 29.07.2023
| Date | Mean value [cm] | Maximum [cm] | Minimum [cm] |
|---|---|---|---|
| 29.07.2023 | 136 | 144 | 128 |
| 28.07.2023 | 136 | 144 | 125 |
| 27.07.2023 | 156 | 171 | 144 |
| 26.07.2023 | 143 | 176 | 117 |
| 25.07.2023 | 115 | 123 | 97 |
| 24.07.2023 | 94 | 100 | 88 |
| 23.07.2023 | 96 | 102 | 90 |
© Bayerisches Landesamt für Umwelt 2024