
- Start >
- Rivers >
- Waterlevel >
- Isar >
- München >
- Chart of year

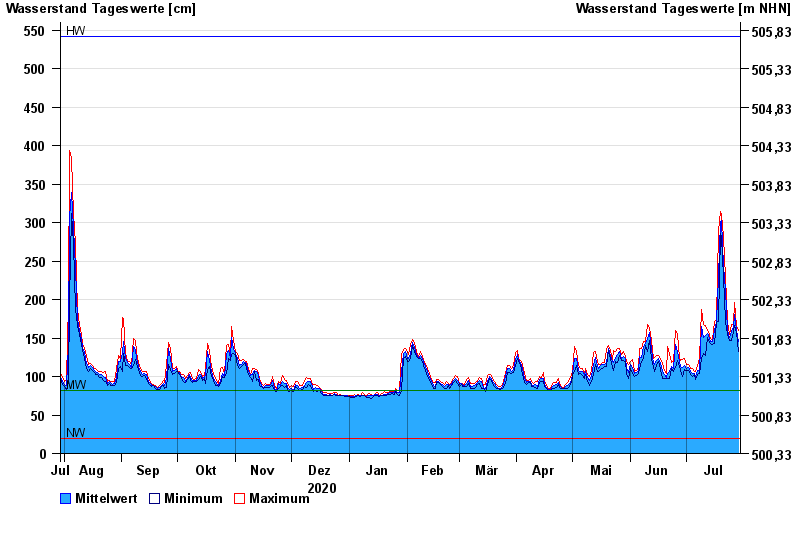
Chart of year München / Isar
Waterlevel from 30.07.2020 to 29.07.2021
| Date | Mean value [cm] | Maximum [cm] | Minimum [cm] |
|---|---|---|---|
| 29.07.2021 | 145 | 160 | 133 |
| 28.07.2021 | 160 | 166 | 157 |
| 27.07.2021 | 180 | 196 | 166 |
| 26.07.2021 | 164 | 168 | 159 |
| 25.07.2021 | 159 | 167 | 147 |
| 24.07.2021 | 151 | 155 | 147 |
| 23.07.2021 | 160 | 171 | 155 |
© Bayerisches Landesamt für Umwelt 2024