
- Start >
- Rivers >
- Waterlevel >
- Isar >
- Mühlried >
- Chart of year

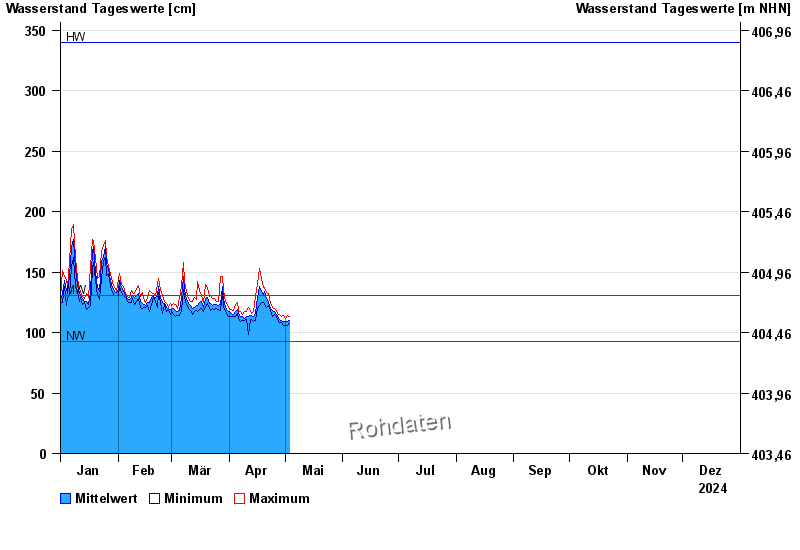
Chart of year Mühlried / Paar
Waterlevel from 01.01.2024 to 31.12.2024
| Date | Mean value [cm] | Maximum [cm] | Minimum [cm] |
|---|---|---|---|
| 16.06.2024 | 152 | 152 | 151 |
| 15.06.2024 | 154 | 157 | 149 |
| 14.06.2024 | 159 | 163 | 154 |
| 13.06.2024 | 166 | 172 | 160 |
| 12.06.2024 | 185 | 202 | 172 |
| 11.06.2024 | 216 | 221 | 200 |
| 10.06.2024 | 212 | 221 | 199 |
© Bayerisches Landesamt für Umwelt 2024