
- Start >
- Rivers >
- Waterlevel >
- Isar >
- Moosburg >
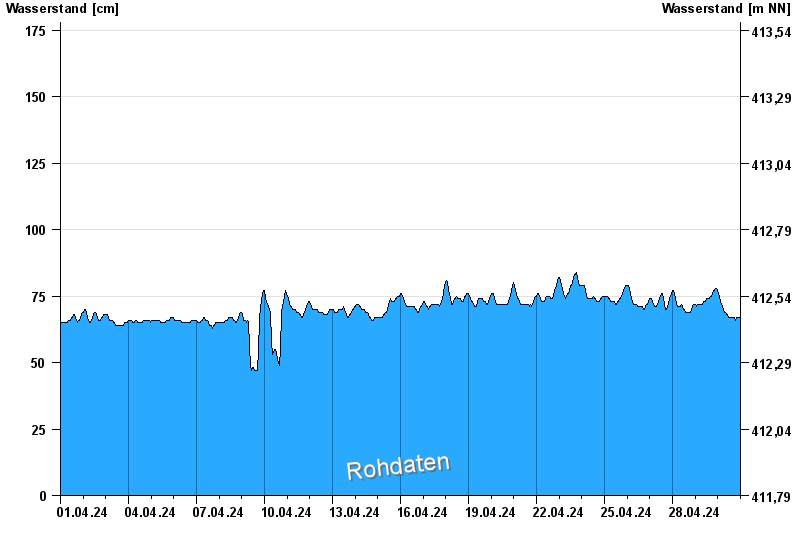
- Chart of month

Chart of month Moosburg / Isar
Waterlevel from 01.04.2024 to 30.04.2024
- 07.10.2009 Wasserstand: 523 cm
- 03.06.2013 Wasserstand: 361 cm
- 04.06.2010 Wasserstand: 314 cm
- 05.08.2020 Wasserstand: 282 cm
- 24.09.2009 Wasserstand: 252 cm
| Date | Waterlevel [cm] |
|---|---|
| 01.05.2024 00:45 | 67 |
| 01.05.2024 00:30 | 67 |
| 01.05.2024 00:15 | 67 |
| 01.05.2024 00:00 | 67 |
| 30.04.2024 23:45 | 67 |
| 30.04.2024 23:30 | 67 |
| 30.04.2024 23:15 | 67 |
© Bayerisches Landesamt für Umwelt 2024