
- Start >
- Rivers >
- Waterlevel >
- Isar >
- Mering >
- Chart of year

Chart of year Mering / Paar
Waterlevel from 16.08.2020 to 15.08.2021
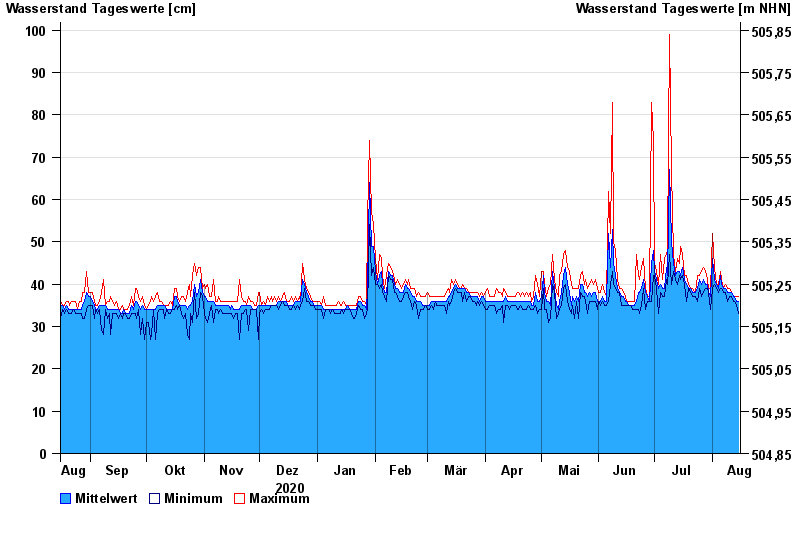
| Date | Mean value [cm] | Maximum [cm] | Minimum [cm] |
|---|---|---|---|
| 15.08.2021 | 36 | 37 | 33 |
| 14.08.2021 | 36 | 37 | 35 |
| 13.08.2021 | 37 | 37 | 36 |
| 12.08.2021 | 37 | 37 | 36 |
| 11.08.2021 | 38 | 38 | 37 |
| 10.08.2021 | 38 | 39 | 37 |
| 09.08.2021 | 38 | 39 | 36 |
© Bayerisches Landesamt für Umwelt 2024