
- Start >
- Rivers >
- Waterlevel >
- Isar >
- Mering >
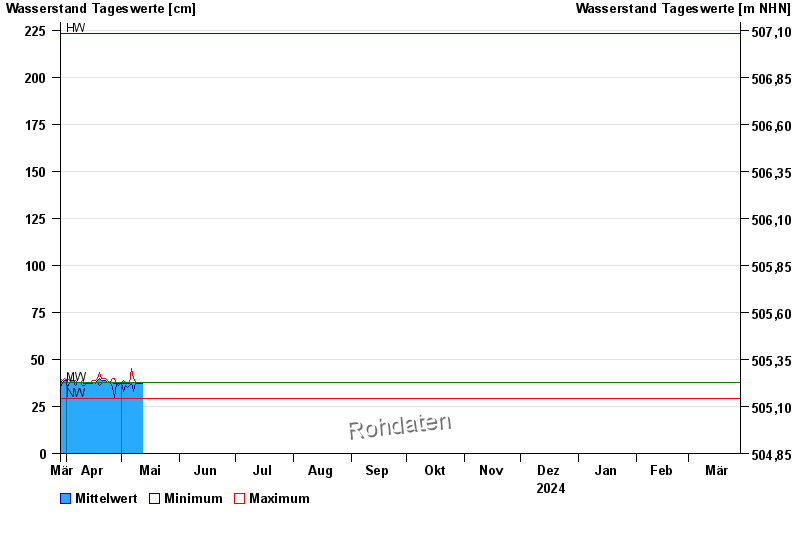
- Chart of year

Chart of year Mering / Paar
Waterlevel from 29.03.2024 to 28.03.2025
| Date | Mean value [cm] | Maximum [cm] | Minimum [cm] |
|---|---|---|---|
| 07.06.2024 | 46 | 46 | 43 |
| 06.06.2024 | 51 | 69 | 43 |
| 05.06.2024 | 87 | 110 | 68 |
| 04.06.2024 | 112 | 116 | 107 |
| 03.06.2024 | 116 | 122 | 111 |
| 02.06.2024 | 156 | 201 | 107 |
| 01.06.2024 | 168 | 194 | 118 |
© Bayerisches Landesamt für Umwelt 2024