
- Start >
- Rivers >
- Waterlevel >
- Isar >
- Mering >
- Chart of year

Chart of year Mering / Paar
Waterlevel from 10.07.2021 to 09.07.2022
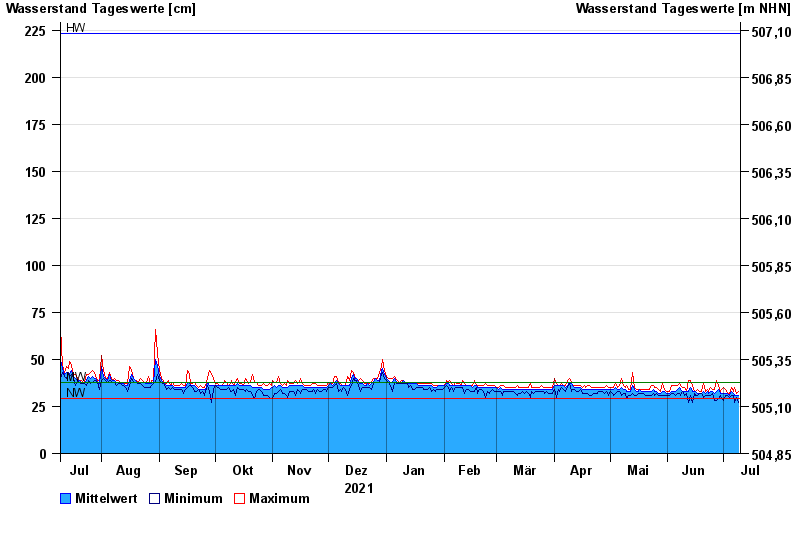
| Date | Mean value [cm] | Maximum [cm] | Minimum [cm] |
|---|---|---|---|
| 09.07.2022 | 31 | 33 | 27 |
| 08.07.2022 | 31 | 32 | 30 |
| 07.07.2022 | 31 | 35 | 27 |
| 06.07.2022 | 32 | 33 | 31 |
| 05.07.2022 | 33 | 35 | 31 |
| 04.07.2022 | 31 | 32 | 30 |
| 03.07.2022 | 32 | 32 | 31 |
© Bayerisches Landesamt für Umwelt 2024