
- Start >
- Rivers >
- Waterlevel >
- Isar >
- Landshut Flutmulde >
- Chart of year

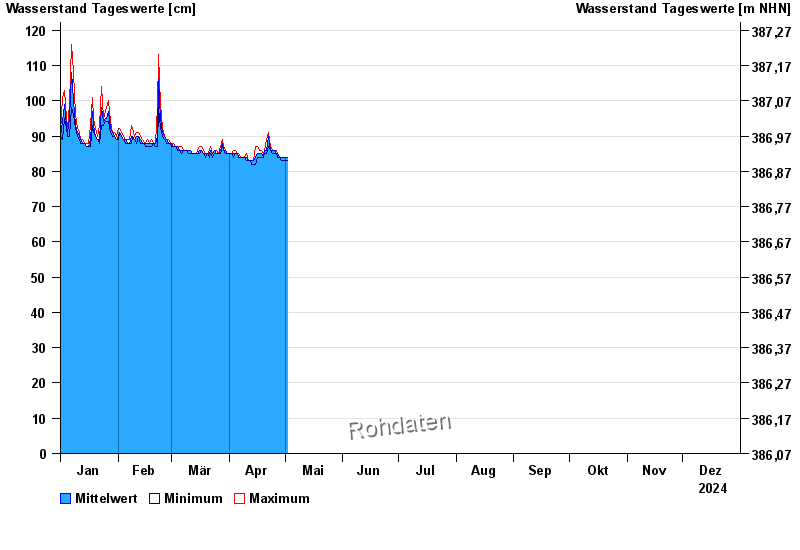
Chart of year Landshut Flutmulde / Isar
Waterlevel from 01.01.2024 to 31.12.2024
- 04.06.2013 Wasserstand: 376 cm
- 25.08.2005 Wasserstand: 359 cm
- 25.05.1999 Wasserstand: 330 cm
- 19.06.1979 Wasserstand: 313 cm
- 04.06.2010 Wasserstand: 257 cm
| Date | Mean value [cm] | Maximum [cm] | Minimum [cm] |
|---|---|---|---|
| 01.06.2024 | 137 | 138 | 136 |
| 31.05.2024 | 106 | 135 | 95 |
| 30.05.2024 | 96 | 97 | 95 |
| 29.05.2024 | 98 | 101 | 96 |
| 28.05.2024 | 116 | 137 | 101 |
| 27.05.2024 | 91 | 111 | 90 |
| 26.05.2024 | 91 | 91 | 90 |
© Bayerisches Landesamt für Umwelt 2024