
- Start >
- Rivers >
- Waterlevel >
- Isar >
- Landsberg >
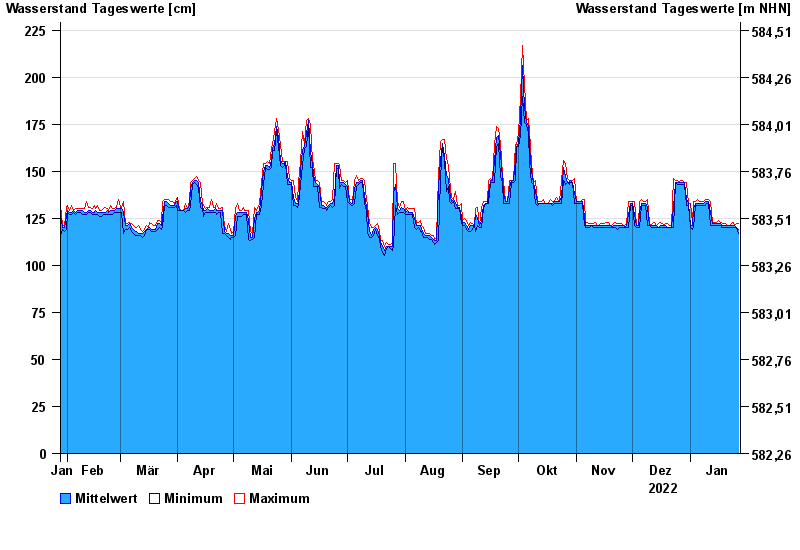
- Chart of year

Chart of year Landsberg / Lech
Waterlevel from 28.01.2022 to 27.01.2023
note
Messwerte beeinflusst durch Kraftwerkssteuerungen.
- 10.08.1970 Wasserstand: 478 cm
- 22.05.1999 Wasserstand: 437 cm
- 23.08.2005 Wasserstand: 414 cm
- 24.07.1966 Wasserstand: 408 cm
- 11.06.1965 Wasserstand: 390 cm
| Date | Mean value [cm] | Maximum [cm] | Minimum [cm] |
|---|---|---|---|
| 27.01.2023 | 119 | 122 | 117 |
| 26.01.2023 | 120 | 122 | 120 |
| 25.01.2023 | 121 | 121 | 120 |
| 24.01.2023 | 121 | 123 | 120 |
| 23.01.2023 | 121 | 122 | 120 |
| 22.01.2023 | 121 | 121 | 120 |
| 21.01.2023 | 121 | 121 | 120 |
© Bayerisches Landesamt für Umwelt 2024