
- Start >
- Rivers >
- Waterlevel >
- Isar >
- Kochel >
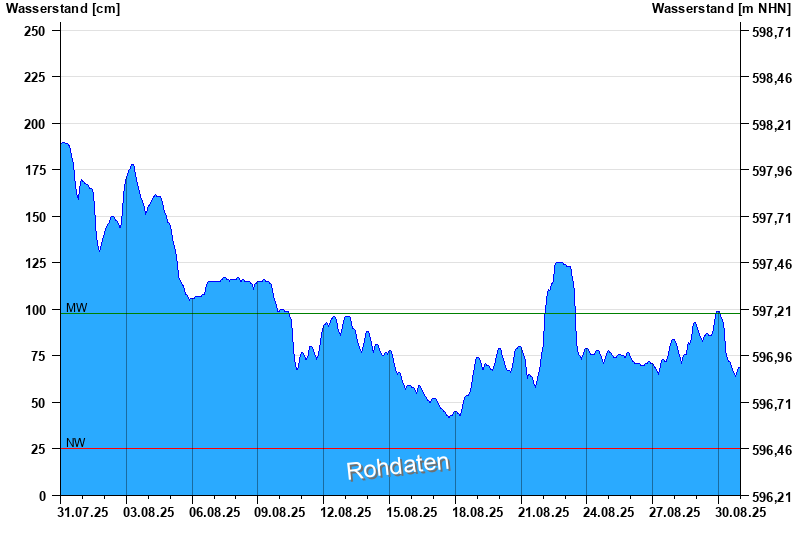
- Chart of month

Chart of month Kochel / Loisach
Waterlevel from 31.07.2025 to 30.08.2025
| Date | Waterlevel [cm] |
|---|---|
| 31.08.2025 00:45 | 68 |
| 31.08.2025 00:30 | 68 |
| 31.08.2025 00:15 | 69 |
| 31.08.2025 00:00 | 69 |
| 30.08.2025 23:45 | 69 |
| 30.08.2025 23:30 | 69 |
| 30.08.2025 23:15 | 69 |
© Bayerisches Landesamt für Umwelt 2025