
- Start >
- Rivers >
- Waterlevel >
- Isar >
- Hochberg >
- Chart of total period

Chart of total period Hochberg / Traun
Waterlevel from 01.11.1969 to 26.04.2024
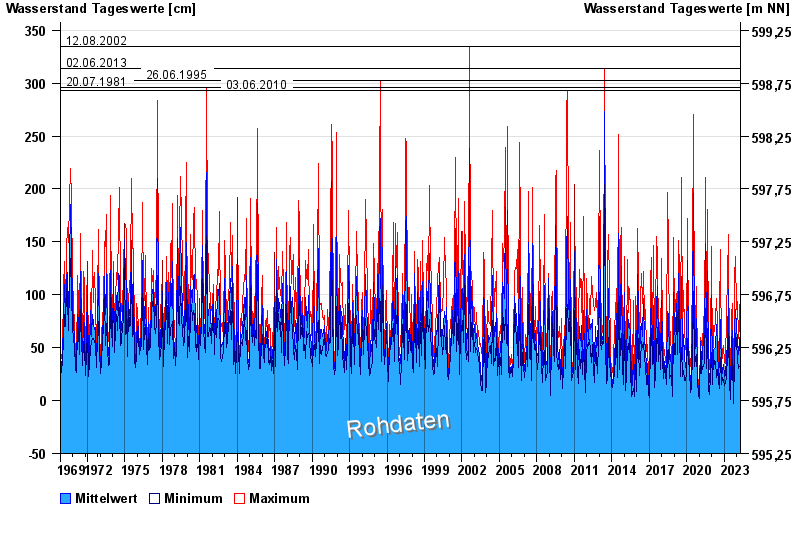
- 12.08.2002 Wasserstand: 335 cm
- 02.06.2013 Wasserstand: 314 cm
- 26.06.1995 Wasserstand: 302 cm
- 20.07.1981 Wasserstand: 296 cm
- 03.06.2010 Wasserstand: 293 cm
| Date | Mean value [cm] | Maximum [cm] | Minimum [cm] |
|---|---|---|---|
| 26.04.2024 | 20 | 20 | 19 |
| 25.04.2024 | 21 | 23 | 19 |
| 24.04.2024 | 22 | 26 | 20 |
| 23.04.2024 | 21 | 24 | 20 |
| 22.04.2024 | 26 | 30 | 23 |
| 21.04.2024 | 30 | 34 | 24 |
| 20.04.2024 | 34 | 39 | 30 |
© Bayerisches Landesamt für Umwelt 2024