
- Start >
- Rivers >
- Waterlevel >
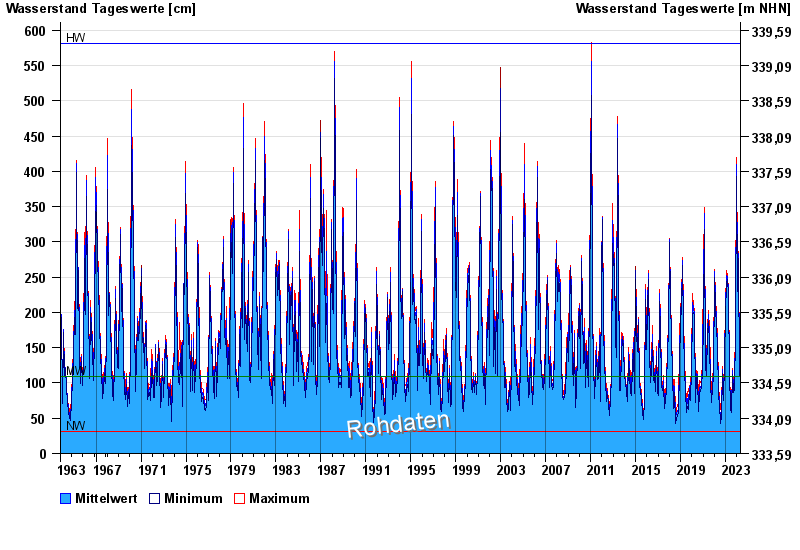
- Isar >
- Heitzenhofen >
- Chart of total period

Chart of total period Heitzenhofen / Naab
Waterlevel from 01.11.1963 to 30.04.2024
| Date | Mean value [cm] | Maximum [cm] | Minimum [cm] |
|---|---|---|---|
| 30.04.2024 | 101 | 102 | 100 |
| 29.04.2024 | 104 | 107 | 101 |
| 28.04.2024 | 109 | 115 | 106 |
| 27.04.2024 | 116 | 118 | 114 |
| 26.04.2024 | 121 | 124 | 117 |
| 25.04.2024 | 129 | 136 | 124 |
| 24.04.2024 | 143 | 150 | 136 |
© Bayerisches Landesamt für Umwelt 2024