
- Start >
- Rivers >
- Waterlevel >
- Isar >
- Grafrath >
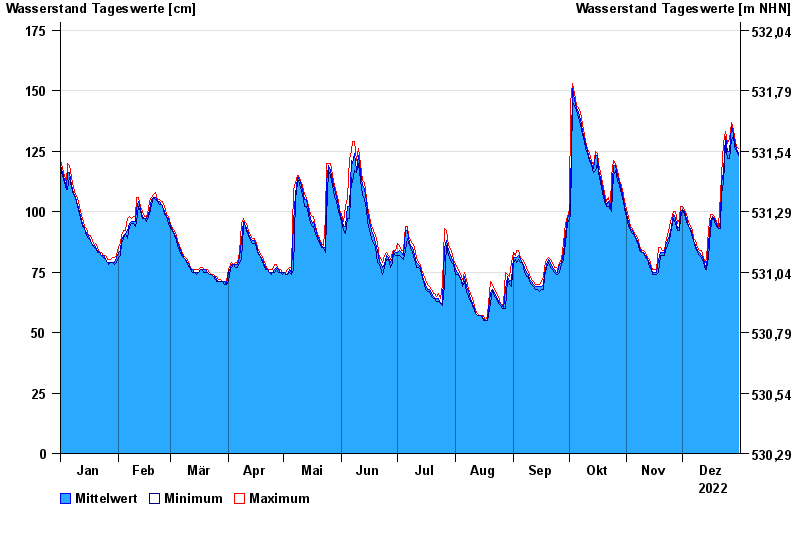
- Chart of year

Chart of year Grafrath / Amper
Waterlevel from 01.01.2022 to 31.12.2022
- 24.05.1999 Wasserstand: 378 cm
- 12.06.1965 Wasserstand: 346 cm
- 21.06.1979 Wasserstand: 294 cm
- 02.06.1965 Wasserstand: 268 cm
- 05.06.2013 Wasserstand: 264 cm
| Date | Mean value [cm] | Maximum [cm] | Minimum [cm] |
|---|---|---|---|
| 31.12.2022 | 124 | 126 | 123 |
| 30.12.2022 | 126 | 127 | 125 |
| 29.12.2022 | 129 | 131 | 127 |
| 28.12.2022 | 132 | 134 | 131 |
| 27.12.2022 | 135 | 137 | 130 |
| 26.12.2022 | 125 | 130 | 122 |
| 25.12.2022 | 125 | 128 | 122 |
© Bayerisches Landesamt für Umwelt 2024