
- Start >
- Rivers >
- Waterlevel >
- Isar >
- Grafrath >
- Chart of year

Chart of year Grafrath / Amper
Waterlevel from 01.01.2024 to 31.12.2024
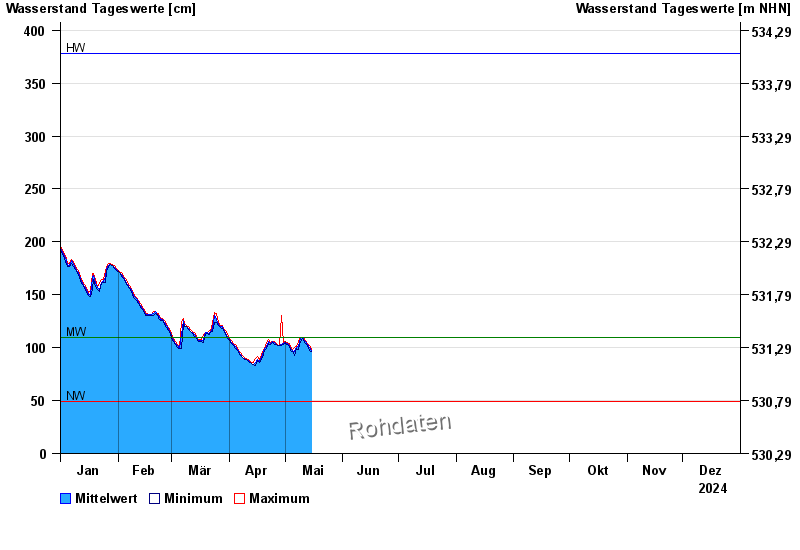
| Date | Mean value [cm] | Maximum [cm] | Minimum [cm] |
|---|---|---|---|
| 04.06.2024 | 220 | 222 | 218 |
| 03.06.2024 | 212 | 218 | 209 |
| 02.06.2024 | 211 | 212 | 210 |
| 01.06.2024 | 193 | 210 | 160 |
| 31.05.2024 | 139 | 159 | 126 |
| 30.05.2024 | 125 | 127 | 122 |
| 29.05.2024 | 121 | 122 | 120 |
© Bayerisches Landesamt für Umwelt 2024