
- Start >
- Rivers >
- Waterlevel >
- Isar >
- Garmisch u. d. Partnachmündung >
- Chart of year

Chart of year Garmisch u. d. Partnachmündung / Loisach
Waterlevel from 19.04.2024 to 18.04.2025
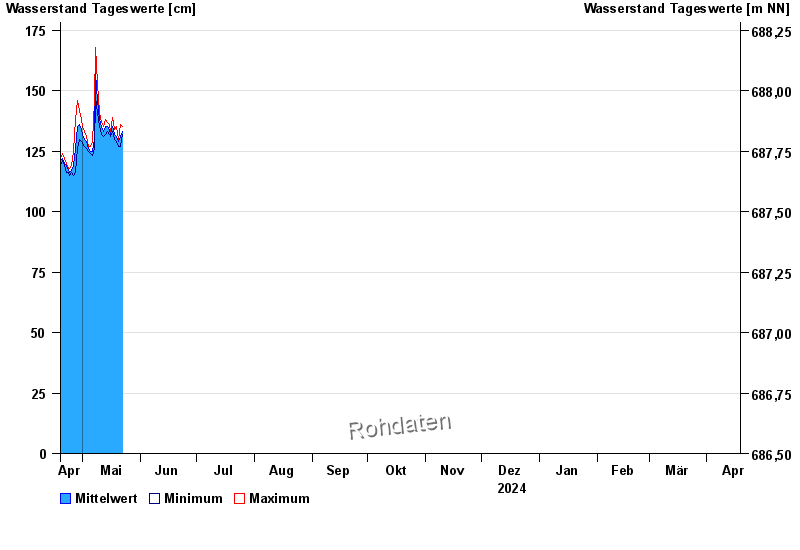
note
Messwerte beeinflusst durch Kraftwerkssteuerungen.
- 22.05.1999 Wasserstand: 410 cm
- 31.05.1940 Wasserstand: 408 cm
- 23.08.1937 Wasserstand: 408 cm
- 23.08.2005 Wasserstand: 374 cm
- 11.06.1965 Wasserstand: 362 cm
| Date | Mean value [cm] | Maximum [cm] | Minimum [cm] |
|---|---|---|---|
| 01.05.2024 | 132 | 135 | 128 |
| 30.04.2024 | 134 | 138 | 129 |
| 29.04.2024 | 136 | 142 | 130 |
| 28.04.2024 | 135 | 146 | 126 |
| 27.04.2024 | 126 | 138 | 116 |
| 26.04.2024 | 119 | 125 | 115 |
| 25.04.2024 | 117 | 119 | 116 |
© Bayerisches Landesamt für Umwelt 2024