
- Start >
- Rivers >
- Waterlevel >
- Isar >
- Farchant >
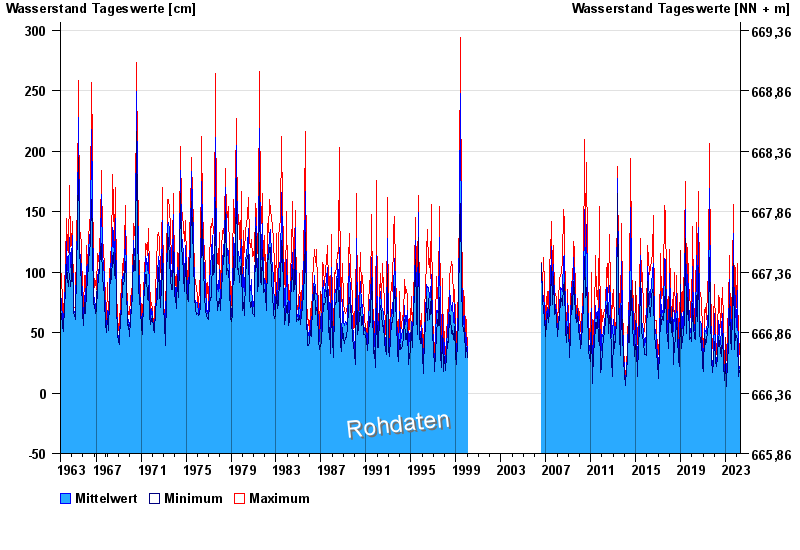
- Chart of total period

Chart of total period Farchant / Loisach
Waterlevel from 01.11.1963 to 26.04.2024
note
Messwerte beeinflusst durch Kraftwerkssteuerungen und Kiesanladungen. Kiesumlagerungen bewirkt Trockenlegung der Messinstrumente ab 12.12.2022
| Date | Mean value [cm] | Maximum [cm] | Minimum [cm] |
|---|---|---|---|
| 26.04.2024 | 15 | 20 | 9 |
| 25.04.2024 | 14 | 16 | 10 |
| 24.04.2024 | 14 | 16 | 10 |
| 23.04.2024 | 15 | 17 | 12 |
| 22.04.2024 | 16 | 20 | 14 |
| 21.04.2024 | 18 | 19 | 13 |
| 20.04.2024 | 20 | 22 | 15 |
© Bayerisches Landesamt für Umwelt 2024