
- Start >
- Rivers >
- Waterlevel >
- Isar >
- Eschenlohe Brücke >
- Chart of year

Chart of year Eschenlohe Brücke / Loisach
Waterlevel from 01.01.2018 to 31.12.2018
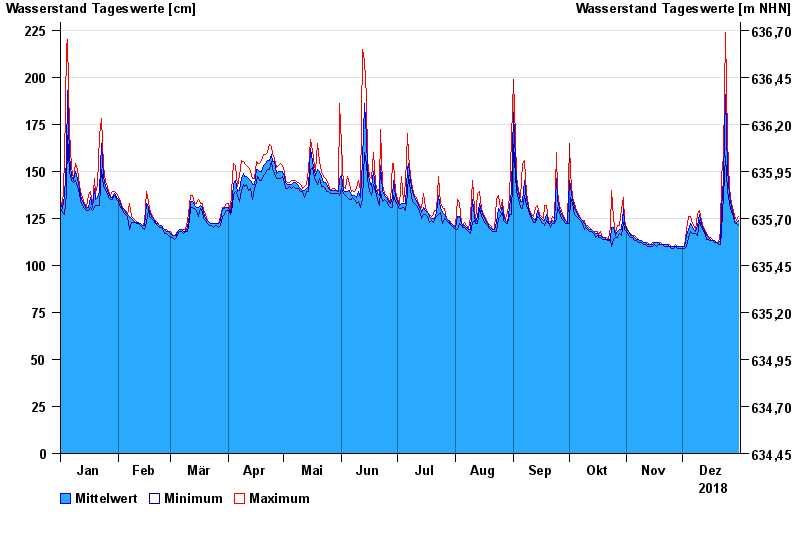
note
Messwerte beeinflusst durch Kraftwerkssteuerungen.
- 02.06.2013 Wasserstand: 328 cm
- 31.08.2010 Wasserstand: 301 cm
- 03.06.2010 Wasserstand: 298 cm
- 10.10.2011 Wasserstand: 241 cm
- 19.09.2013 Wasserstand: 239 cm
| Date | Mean value [cm] | Maximum [cm] | Minimum [cm] |
|---|---|---|---|
| 31.12.2018 | 124 | 126 | 121 |
| 30.12.2018 | 123 | 124 | 122 |
| 29.12.2018 | 124 | 126 | 123 |
| 28.12.2018 | 127 | 129 | 126 |
| 27.12.2018 | 131 | 133 | 128 |
| 26.12.2018 | 137 | 141 | 133 |
| 25.12.2018 | 151 | 167 | 140 |
© Bayerisches Landesamt für Umwelt 2024