
- Start >
- Rivers >
- Waterlevel >
- Isar >
- Eschenlohe Brücke >
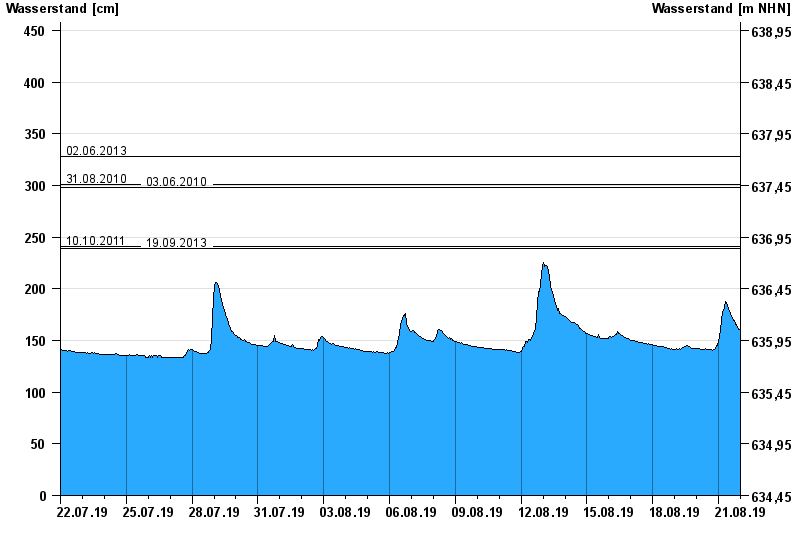
- Chart of month

Chart of month Eschenlohe Brücke / Loisach
Waterlevel from 22.07.2019 to 21.08.2019
note
Messwerte beeinflusst durch Kraftwerkssteuerungen.
- 02.06.2013 Wasserstand: 328 cm
- 31.08.2010 Wasserstand: 301 cm
- 03.06.2010 Wasserstand: 298 cm
- 10.10.2011 Wasserstand: 241 cm
- 19.09.2013 Wasserstand: 239 cm
| Date | Waterlevel [cm] |
|---|---|
| 22.08.2019 00:45 | 159 |
| 22.08.2019 00:30 | 159 |
| 22.08.2019 00:15 | 159 |
| 22.08.2019 00:00 | 159 |
| 21.08.2019 23:45 | 160 |
| 21.08.2019 23:30 | 159 |
| 21.08.2019 23:15 | 160 |
© Bayerisches Landesamt für Umwelt 2024