
- Start >
- Rivers >
- Waterlevel >
- Isar >
- Engfurt >
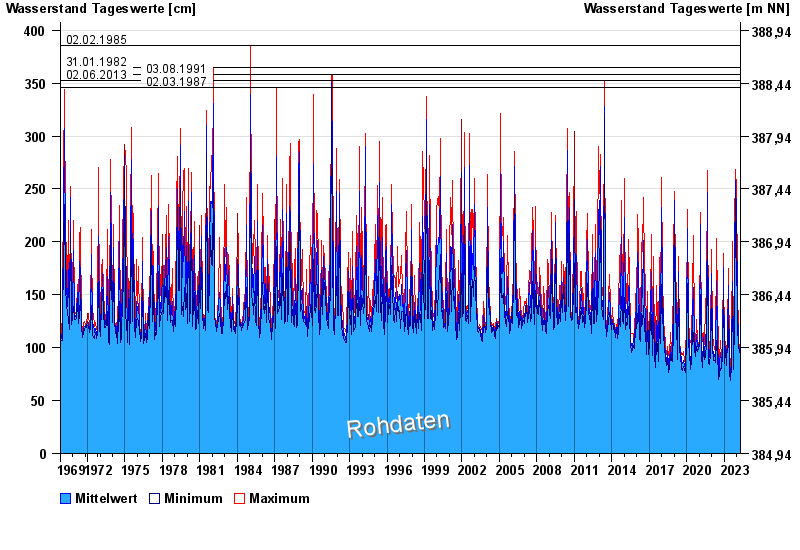
- Chart of total period

Chart of total period Engfurt / Isen
Waterlevel from 01.11.1969 to 26.04.2024
note
zeitweise Beeinflussung durch Kraftwerksbetrieb möglich
- 02.02.1985 Wasserstand: 386 cm
- 31.01.1982 Wasserstand: 365 cm
- 03.08.1991 Wasserstand: 358 cm
- 02.06.2013 Wasserstand: 352 cm
- 02.03.1987 Wasserstand: 346 cm
| Date | Mean value [cm] | Maximum [cm] | Minimum [cm] |
|---|---|---|---|
| 26.04.2024 | 91 | 91 | 89 |
| 25.04.2024 | 92 | 95 | 90 |
| 24.04.2024 | 93 | 95 | 90 |
| 23.04.2024 | 97 | 101 | 95 |
| 22.04.2024 | 99 | 102 | 93 |
| 21.04.2024 | 92 | 93 | 91 |
| 20.04.2024 | 92 | 93 | 91 |
© Bayerisches Landesamt für Umwelt 2024